

XRPUSD Medium-term Trend: Bearish
- Resistance Levels: $0.56, $0.58, $ 0.60
- Support Levels: $0.36, $0.34, $0.32
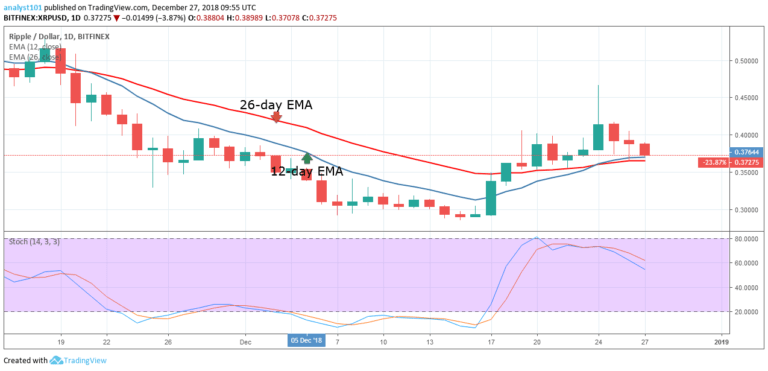
The XRPUSD pair is still in a bearish trend as the price retraces from the recent high. From the price action, the XRP price had been retracing consistently. On December 25, the crypto’s price retraced and closed at a price of $0.39 from the recent high of $0.46. On December 26, the crypto retraced and closed at $0.38. Today, the crypto is retracing and approaching the low of $0.37.
It is likely that the price may close at that level or depreciates further. However, if the price retraces and breaks the 12-day EMA and the 26-day EMA, the crypto will further depreciate. the Stochastic indicator is in the range below 60% which indicates that the price of XRP is in a bearish momentum.
XRPUSD Short-term Trend: Bearish

On the 4-hour chart, the XRP price is in a bearish trend. The 12-day EMA and the 26-day EMA were previously in a horizontal pattern because the crypto was fluctuating at the $0.38 price level. Meanwhile, the crypto’s price is below the 12-day EMA and the 26-day EMA which indicates that price is likely to fall.
In addition, the Stochastic is in the oversold region and below the 20% range which indicates that the crypto is in a strong bearish momentum.
The views opinions expressed here do not reflect that of CryptoGlobe.com and do not constitute financial advice. Always do your own research.


