

XRPUSD Medium-term Trend: Bullish
- Resistance Levels: $0.56, $0.58, $ 0.60
- Support Levels: $0.40, $0.38, $0.36
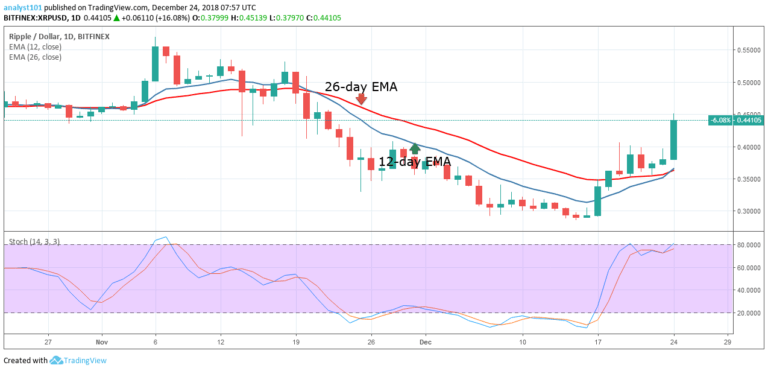
From the daily chart, the XRPUSD pair had been in a bullish trend in the last one week. The crypto’s price was ranging above the $0.36 price level on 12-day EMA in the previous week. Today, the crypto’s price has broken the range bound movement in a bullish trend. The price also had broken the $0.40 resistance level.
The XRP price has one more hurdle to jump over. That is the resistance level at the $0.50 price level has to be broken for XRP price to reach the highs of $0.55 and $ 0.60. The Stochastic is approaching the 80% range which indicates the crypto’s price is in a bullish momentum and a buy signal.
Meanwhile, the crypto’s price is above the 12-day EMA and the 26-day EMA indicating that price is in the bullish trend zone. Price is not expected at the downside except the EMAs are broken on the downward side.
XRPUSD Short-term Trend: Bullish

On the 4-hour chart, the XRP price is in a bullish trend. The price of XRP price trends on the 12-day EMA as a support level. The crypto has broken all the resistance levels of $ 0.36, $0.38 and the $0.40 price levels as price approaches the next resistance at $0.50. The crypto’s price may face resistance at the $0.50 price level.
On the 4-hour chart, the Stochastic is in the overbought region at the 80% range which indicates that the XRP is in a bullish momentum and a buy signal.
The views opinions expressed here do not reflect that of CryptoGlobe.com and do not constitute financial advice. Always do your own research.


