

XRPUSD Medium-term Trend: Bullish
- Resistance Levels: $0.56, $0.58, $ 0.60
- Support Levels: $0.38, $0.36, $0.34
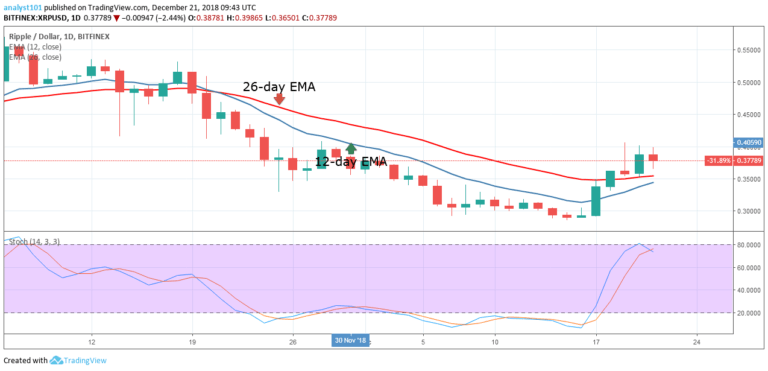
The XRPUSD pair was in a bullish trend as price broke the 12-day EMA and the 26-day EMA. However, the XRP price could not break the $0.40 price level but rather it was ranging below it.XRP price ranges at the $0.38 price level. This range-bound movement will lead to another price breakout.
At the end of the range bound movement, if the price breaks the $0.40 price level, the crypto will reach the high of $0.50, but the crypto’s price will face resistance at the $0.45 and $0.50 price levels. On the downside, if the price breaks below the $0.38 price level, it may revisit the previous low of $ 0.33.
Meanwhile, the Stochastic indicator is in the range below 80% which indicates that the crypto has a bearish momentum and a sell signal. The stochastic bands are making U-turn after a bullish momentum.
XRPUSD Short-term Trend: Bullish

On the 4-hour chart, the XRP price is in a bullish trend. The XRP price is still above the 12-day EMA and the 26-day EMA indicating that the price is in the bullish trend zone. However, if the price breaks the EMAs, the crypto is likely to resume its downward trend. Meanwhile, the Stochastic is below the 60% range. That is, XRP has a bearish momentum and a sell signal.
The views opinions expressed here do not reflect that of CryptoGlobe.com and do not constitute financial advice. Always do your own research.


