

XRPUSD Medium-term Trend: Bearish
- Resistance Levels: $0.56, $0.58, $ 0.60
- Support Levels: $0.37, $0.35, $0.33
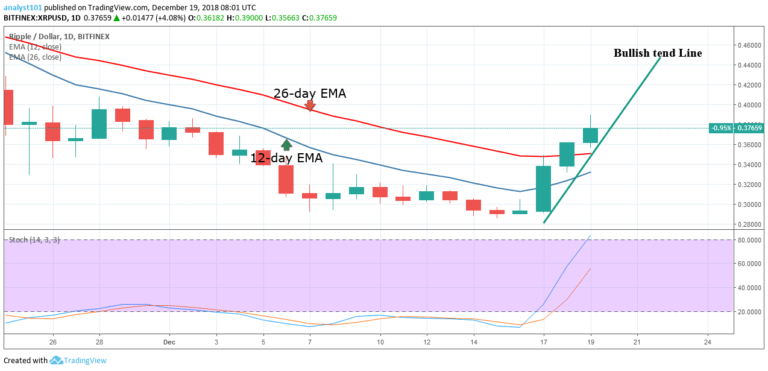
The XRPUSD pair was in a bullish trend yesterday. In fact, this is the third day of a bullish trend as per the three candlesticks. The XRP price is now in the bullish trend zone as the price is above the 12-day EMA and the 26-day EMA which indicates that the price is likely to rise. As the price rises, we expect it to reach the high of $0.40 but may face resistance at that level.
How long will the current bullish trend last? A bullish trend line has been drawn to determine the duration of the trend. A bullish trend is considered ongoing when the price makes a series of higher highs and higher lows. Presently the bullish trend is ongoing. Similarly, a bullish trend is said to be terminated when the price breaks the trend line and the corresponding candlestick closes opposite it.
XRPUSD Short-term Trend: Bullish

On the 4-hour chart, the XRP price is in a bullish trend. The crypto’s price is approaching the high of $0.38 but currently retracing from the recent high. If the XRP price retraces and breaks the EMAs, the current trend is said to be terminated. The price will be in the bearish trend zone.
However, if the crypto’s price remains above the EMAs, the bullish trend may continue trending. The Stochastic is in the overbought region above the 80% range. This implies that XRP price has a strong bullish momentum.
The views opinions expressed here do not reflect that of CryptoGlobe.com and do not constitute financial advice. Always do your own research.


