
Dummy text. Please change.

XRPUSD Medium-term Trend: Ranging
- Resistance Levels: $0.56, $0.58, $ 0.60
- Support Levels: $0.30, $0.28, $0.26
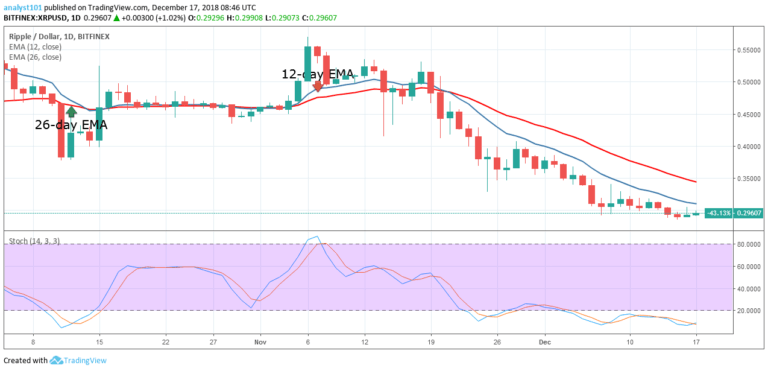
Last week the XRP price was in a bearish trend. On December 15, the XRP price fell to the low of $0.28 but recovered at the $0.29 price level. Also, it was suggested that the crypto will reach the previous low of $0.24 but fell to the low of $0.28. The XRP price is still expected to revisit the previous low because the price is still below the 12-day EMA and the 26-day EMA which indicates a bearish trend.
The 12-day EMA and the 26-day EMA are pointing southward indicating that the price is expected to fall. Meanwhile, the Stochastic is in the oversold region below the 20% range which confirms that XRP has a bearish momentum and a sell signal.
XRPUSD Short-term Trend: Ranging

On the 4-hour chart, the XRP price is in a sideways trend. The crypto’s price had been fluctuating below the 12-day EMA and the 26-day EMA. The bulls had not been able to break the 12-day EMA and the 26-day EMA to the upside. Last week the crypto’s price was resisted by the EMAs on three occasions.
The Stochastic is in the range above 40%. That is the XRP price has bullish momentum and a buy signal.
The views opinions expressed here do not reflect that of CryptoGlobe.com and do not constitute financial advice. Always do your own research.


