

XRPUSD Medium-term Trend: Bearish
- Resistance Levels: $0.56, $0.58, $ 0.60
- Support Levels: $0.30, $0.28, $0.26
Yesterday, the XRPUSD pair was in a bearish trend approaching the low of $0.30. It was suggested that if the bears broke this level, the crypto would find support at the previous low. Meanwhile, in the last 24 hours, there was no significant price change as the crypto was said to be in range bound movement. On December 6, the crypto’s price fell to the low of $0.31, and it was fluctuating above the price level.
A small body candlesticks like Doji and Spinning tops described the indecision of buyers and sellers at the $0.31 price level. In a couple of days, a price breakout is imminent. Meanwhile, the Stochastic is in the oversold region below the 20% range. This indicates that XRP has strong bearish momentum and a sell signal.
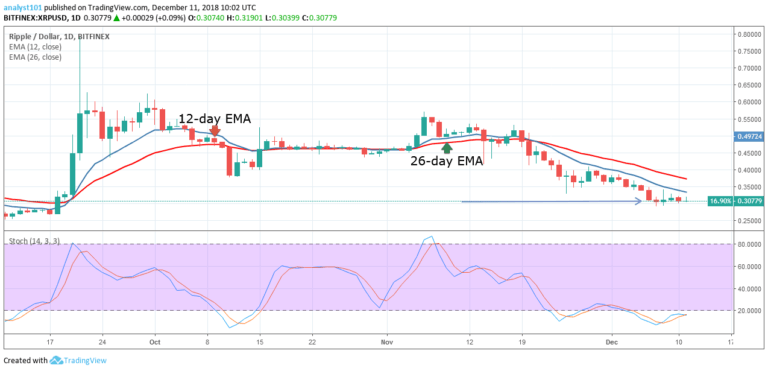
XRPUSD Short-term Trend: Ranging

On the short term trend, the XRP price is in a sideways trend. From the price action, the crypto’s price is below the 12-day EMA and the 26-day EMA which indicates that the price is likely to fall. The XRP price is likely to fall if the bears break the $0.30 price level. All bullish movements may face resistance at the $0.32 price level.
Meanwhile, the Relative Strength Index period 14 is level 42 which indicates that the price is in the sideways trend zone.
The views opinions expressed here do not reflect that of CryptoGlobe.com and do not constitute financial advice. Always do your own research.


