
XRPUSD Long-term Trend – Ranging
Distribution territories: $0.55, $0.60, $65
Accumulation territories: $0.25, $0.20, $0.15
The price of XRP has been going through significant lower lows and lower highs after hitting the $0.4 mark and seeing it get breached southwards. The crypto saw its price drop to around the $0.3 mark on November 25, and move around it since then.

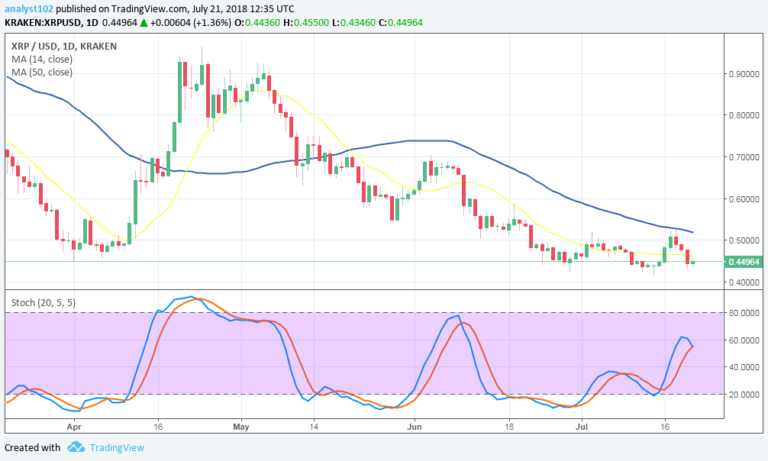
XRP is now apparently caged within its range. The 14-day SMA has moved down below the 50-day SMA, and is currently around the $0.4 mark. The Stochastic Oscillators are currently at range 25, and are seemingly about to consolidate.
Indicators still show the bears have a strong position in the market, and may still take XRP down below the current $0.3 mark. If it does investors may find profitable positions buying the dip and going long.
The views and opinions expressed here do not reflect that of CryptoGlobe.com and do not constitute financial advice. Always do your own research.


