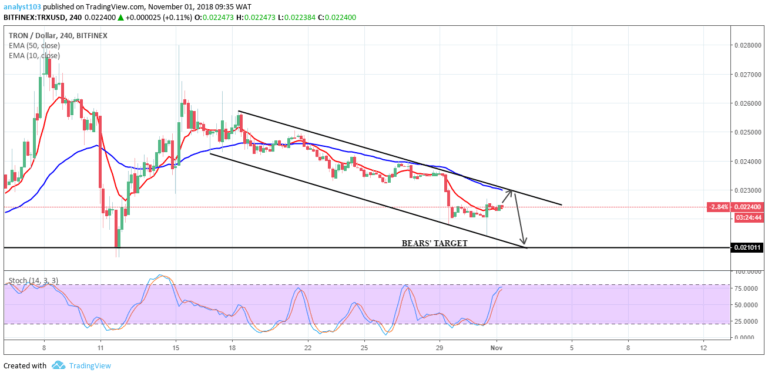
Tron Price Medium-term Trend: Bearish
- Supply zones: $0.02500, $0.02600, $0.02700
- Demand zones: $0.01000, $0.00900, $0.00800
TRX remains in a bearish trend in its medium-term outlook. After the drop from the 61.8 fib level to $0.01338 in the demand area, the bulls return was signalled with an engulfing candle with TRXUSD initially up at $0.01446. $0.01575 was retested as the high of the day as the bullish momentum increased. This was the 61.8 fib level, a trend reversal zone with the bears staging a return before the end of yesterdays session.
The bears’ pressure was sustained at today’s opening with a bearish candle as TRXUSD was down $0.01400 in the demand area. A break in the key demand area is imminent for continuation to retest the $0.01110 in the demand area. Price is below the two EMAs and the signal of the stochastic oscillator at 33% points down an indication of downward price movement in the medium-term.
TRX/USD Short-term Trend: Bearish
The cryptocurrency is in bearish trend in its short-term outlook. The critical supply area was a strong resistance against upward movement. $0.01575 was the high yesterday before the drop to $0.01423 in the demand area. Despite a bullish 1-hour opening candle at $0.01448, the bears’ pressure was strong as TRXUSD had dropped to $0.01400 earlier today.
Price is below the two EMAs crossover an indication of bears presence. The stochastic oscillator is in the oversold region and its signal points down at 11% an indication of downward price movement in the short-term.
The views and opinions expressed here do not reflect that of CryptoGlobe.com and do not constitute financial advice. Always do your own research.


