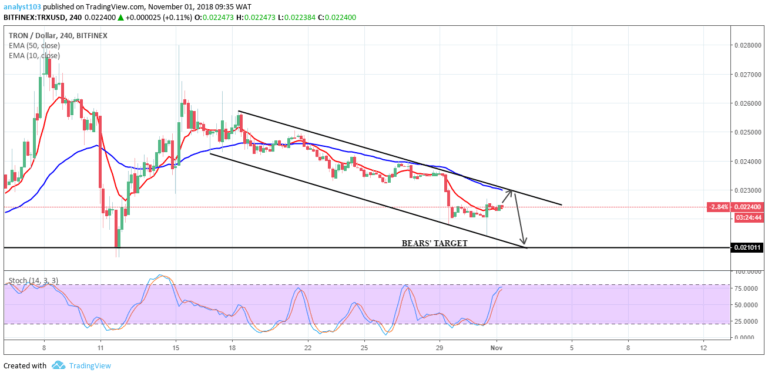
TRX/USD Medium-term Trend: Ranging
Supply zones: $0.02500, $0.02600, $0.02700
Demand zones: $0.0100, $0.0080, $0.0060
Tron’s TRX is range-bound on the medium-term, as the formation of an inverted hammer at the $0.0157 mark on November 29 signaled a trend reversal. The bullish pressure that pushed the cryptocurrency’s price down to $0.0176 was weakened, and the two EMAs that were serving as a support were broken as the bearish pressure increased.
TRX is in consolidation while trading between the $0.0166 level at the upper level of its range and the $0.0134 level at the lower end of its rage. Traders should wait for a price breakout above the upper area or a breakdown below the low one before taking a position.
TRX/USD Short-term Trend: Bearish
The cryptocurrency is in a bearish trend in the short-term. The formation of a marubozu candle at the close of yesterday’s trading session provided a strong indication of the bears’ control of the market. The $0.01420 mark in the demand area was an initial low.
TRX is below the two EMAs’ crossover with a bearish hammer formation suggesting the pullback may be over as the bears are signaling a return. The day may still see new lows.
The views and opinions expressed here do not reflect that of CryptoGlobe.com and do not constitute financial advice. Always do your own research.


