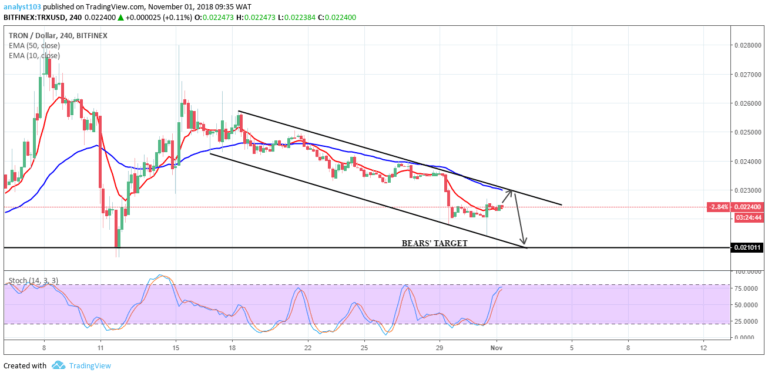
TRX/USD Medium-term Trend: Bearish
- Supply zones: $0.02500, $0.02600, $0.02700
- Demand zones: $0.01000, $0.00900, $0.00800
TRX is in a bearish trend its medium-term outlook. After an impressive downward move to $0.01229 in the demand area on 7th December, the bears lost momentum, TRXUSD rose to $0.1420 in the supply area as the bulls took control of the market. This was soon lost at $0.1439 after the formation of a bearish inverted hammer momentum as the bears’ return. TRXUSD was down to $0.1370 late yesterday.
Today’s 4-hour opening candle at $0.1339 was a bearish spinning top – an indication of bears continued dominance as TRXUSD dropped to $0.1330 in the demand area.
Price is below the two EMAs crossover and the stochastic oscillator signal points down at 47%. These suggest further downward price movement in the medium-term.
A break at $0.01248 in the demand area will open the gate for a retest at $0.1110 as the bears’ pressure becomes strong in the medium-term.
TRX/USD Short-term Trend: Bearish
The cryptocurrency is in a bearish trend in its short-term outlook. The bearish hammer at $0.01416 brought back the bears as TRXUSD was down to $0.01370. Increased bearish momentum dropped TRXUSD $0.01330.
The price is below the two EMAs crossover and the stochastic oscillator in the oversold region at 17% and its signal points down. This implies downward momentum and a possible retest of $0.01230.
The views and opinions expressed here do not reflect that of CryptoGlobe.com and do not constitute financial advice. Always do your own research.


