
XMRUSD Medium-term Trend: Bearish
- Supply zones: $120, $130, $140
- Demand zones: $ 50, $40, $40
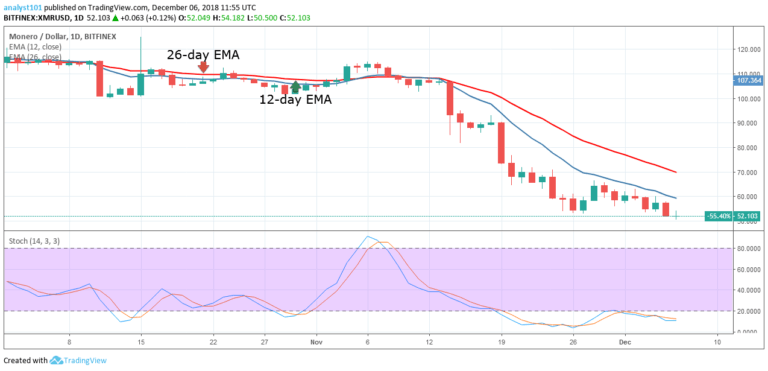
Yesterday, December 5, the price of Monero was in a bearish trend as the crypto closed at a price of $52. Today, the XMRUSD pair is still in a downtrend. The crypto’s price is below the 12-day EMA and the 26-day EMA indicating that the price is likely to fall. In addition, the Stochastic indicator shows that the cryptocurrency has been oversold since on November 19 and the crypto is below 20% range.
This implies that the price of Monero has strong bearish momentum since November 19 and even now. That is, the crypto’s price is likely to continue its downtrend. As long as the Stochastic bands are below the 20% range the crypto will remain bearish.
XMRUSD Short-term Trend: Ranging

On the short term trend, the price of Monero was in a sideways trend. The crypto’s price made a bullish movement and broke the 12-day EMA, the 26-day EMA and reached the high of $66. However, the bulls could not sustain te price above the EMAs and price fell to the low of $57.
Nevertheless,the crypto’s price becomes range bound at this level before falling into the bearish trend zone. the price of Monero is likely to fall because it is below the EMAs.
The views and opinions expressed here do not reflect that of CryptoGlobe.com and do not constitute financial advice. Always do your own research.