
 Litecoin Chart by Trading View
LTCUSD Medium-term Trend: Ranging
Resistance Levels: $65, $67, $69
Support Levels: $30, $28, $26
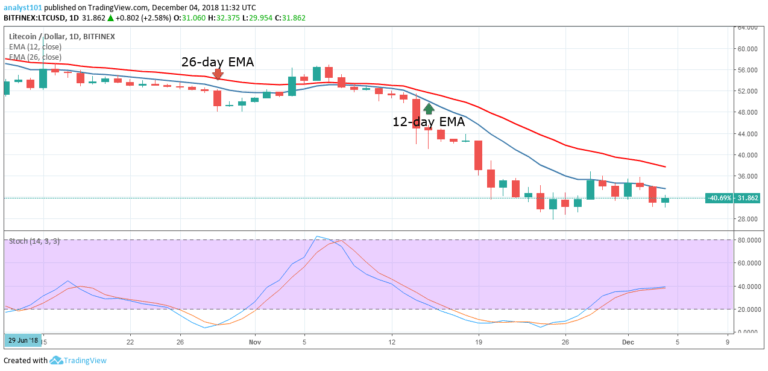
Litecoin’s price has been in a sideways trend for the last week. On November 24, the cryptocurrency’s price fell to a $29 low and entered a range-bound movement. It has since then been fluctuating above the $29 level.
LTC is currently below its 12 and 26-day EMAs, which shows the price is likely to keep on falling. Additionally, the Stochastics is at range 40, indicating bullish momentum and a buy signal. If the price breaks through the EMAs, it’s likely to keep on rising.
On the other hand, if the crypto’s price is resisted by the EMAs, it will continue its range-bound movement.
LTCUSD Short-term Trend: Ranging
 Litecoin Chart by Trading View
On the short-term trend, price of Litecoin is in a sideways trend. On December 3, it fell to a low of $30 and started a bullish movement. Litecoin’s price is below the EMAs which indicates that it is in a bearish trend.
The views and opinions expressed here do not reflect that of CryptoGlobe.com and do not constitute financial advice. Always do your own research.


