
 Ethereum Chart By Trading View
ETHUSD Medium-term Trend: Ranging
- Resistance Levels: $230, $240, $250
- Support Levels: $100, $90, $80
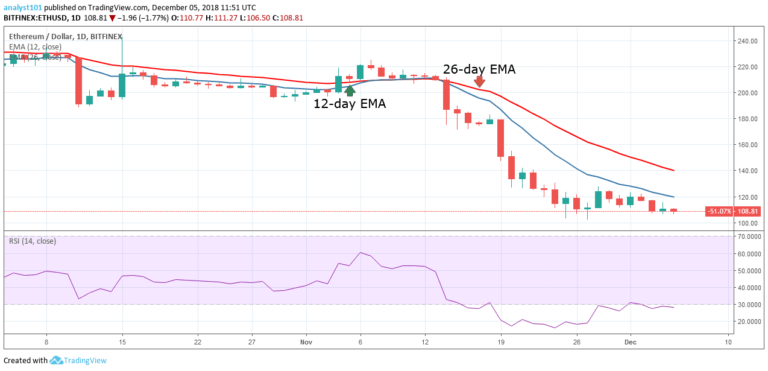
The ETHUSD pair had been fluctuating above the $100 price level as price reached the oversold region of the market. The price of Ethereum is below the 12-day EMA and the 26-day EMA indicating that price is in the bearish trend zone. In addition, the Relative Strength Index period 14 is level 28 which indicates that the price has reached the oversold region of the market. In other words, the bears appear to have exhausted their bearish pressure for now.
Ethereum Price Short-term Trend: Ranging
 Ethereum Chart By Trading View
On the short-term trend, the price of Ethereum is in a sideways trend. On November 27, the cryptocurrency fell to its low at $102.20 and it commenced a bullish movement to the high of $124. The $102 price level is now the current support level while the $124 price level is the current resistance level.The bears had not been able to break below the $102 price level.
On December 1, the bulls were resisted at the $120 price level, and the bears brought price to its low on December 3. Meanwhile, the crypto’s price is below the 12-day EMA and the 26-day EMA indicating that price is likely to fall. In addition, the Stochastic indicator is in the range below 20% which indicates that the crypto has a bearish momentum and a sell signal.
The views and opinions expressed here do not reflect that of CryptoGlobe.com and do not constitute financial advice. Always do your own research.


