
 Ethereum Chart By Trading View
ETHUSD Medium-term Trend: Bullish
- Resistance Levels: $230, $240, $250
- Support Levels: $130, $120, $100
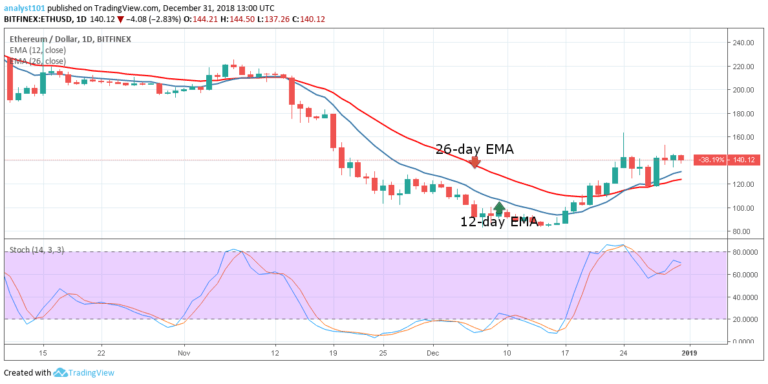
Last week, price of Ethereum was in the bullish trend zone. On December 24, the crypto’s price reached the high of $163.50 but price pulled back to the low of $142.53. On December 27, the crypto’s price fell to the low of $118.57 and commenced a bullish movement. At the bullish trend zone, the 12-day EMA and the 26-day EMA acted as a support for the price of Ethereum.
The crypto’s price has the tendency to rise because the price is above the EMAs. The price of Ethereum is currently trading at $139.51 price level. If the bulls break the $140 price level, the crypto is likely to reach the highs of $145 and the $150 price levels. On the downside, if the bulls fail to break the $140 price, the crypto will find support at the $120 price level.
Meanwhile, the stochastic is approaching the overbought region near the 80% range which indicates that Ethereum is in strong bullish momentum and a buy signal.
ETHUSD Short-term Trend: Bullish
 Ethereum Chart By Trading View
On the 4-hour chart, the price of Ethereum is in a bearish trend. Last week the price of Ethereum reached the high of $140.50 and it commenced a range bound movement above the EMAs. The crypto’s price is above the 12-day EMA and the 26-day EMA which indicates that price is likely to rise.If the crypto’s price breaks below the EMAs to the downside, the ETH price is likely to fall.
The views and opinions expressed here do not reflect that of CryptoGlobe.com and do not constitute financial advice. Always do your own research.


