
 Ethereum Chart By Trading View
ETHUSD Medium-term Trend: Bearish
- Resistance Levels: $230, $240, $250
- Support Levels: $130, $120, $100
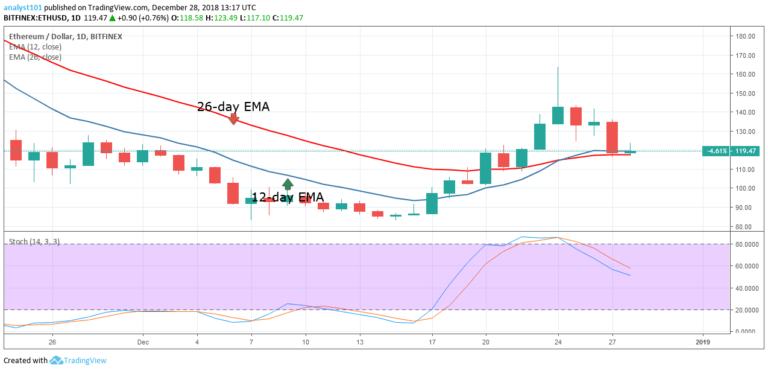
Yesterday, the ETHUSD pair was in a bearish trend. The crypto’s price fell to the low of $118.57 but was resisted by the 12-day EMA and the 26-day EMA. The EMAs now acted as a support for the price of Ethereum. However, On December 27, there were more selling at the $120 price level. As a result of the broken support at $120, the crypto may likely fall to the low of $110.
Meanwhile, the crypto’s price is above the 12-day EMA and the 26-day EMA which indicates that the price is in the bullish trend zone. Also, the Stochastic indicator is out of the overbought region but below the 60% range which indicates that Ethereum is in a bearish momentum.
ETHUSD Short-term Trend: Bearish
 Ethereum Chart By Trading View
On the short-term trend, the price of Ethereum is in a bearish trend. The crypto’s price fell to the low of $118.08 and commenced a bullish movement above that price level. The crypto’s price is below the 12-day EMA and the 26-day EMA which indicates that the price is likely to fall. The stochastic bands are in the oversold region but below the 20% range which indicates that Ethereum is in a strong bearish momentum.
The views and opinions expressed here do not reflect that of CryptoGlobe.com and do not constitute financial advice. Always do your own research.


