
 Ethereum Chart By Trading View
ETHUSD Medium-term Trend: Bullish
- Resistance Levels: $230, $240, $250
- Support Levels: $100, $90, $80
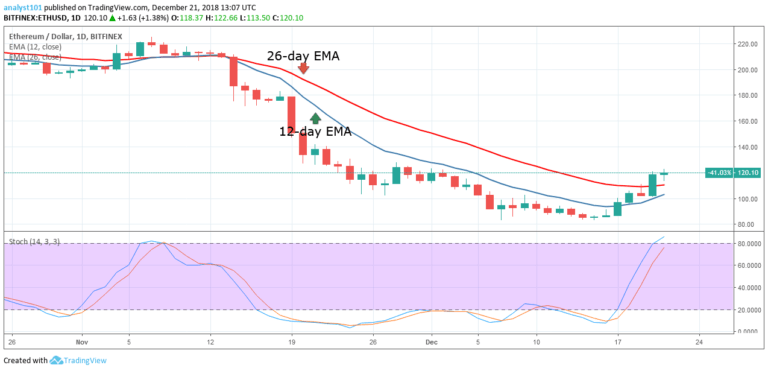
The price of Ethereum is still in a bullish trend as price approaches the $120 resistance level. The crypto had earlier broken the 12-day EMA, 26-day EMA and the $100 resistance level to reach the bullish trend zone. The 12-day EMA and the 26-day EMA are pointing northward indicating a bullish trend. The crypto’s price is approaching the price at $120 but may face resistance at that price level.
If the bulls break through the $120 resistance, the crypto is likely to reach the high of $200. On the other hand, if the bulls were resisted at the $120 price level, the price of Ethereum will find support a $110. Meanwhile, the Stochastic indicator is approaching the range below 80%. This indicates that Ethereum is in a bullish momentum and a buy signal after several weeks in the oversold region.
ETHUSD Short-term Trend: Bullish
 Ethereum Chart By Trading View
On the short-term trend, the price of Ethereum is in a bullish trend. The price of Ethereum is making a series of higher highs and higher lows. The exponential moving averages are pointing in the direction of the bullish trend. The crypto’s price is attempting to break the $120 price level.The stochastic bands are in the overbought region above the 80% range.
The price of Ethereum is now in a strong bullish momentum and a buy signal. The bullish momentum will continue as long as the stochastic bands are in the overbought region.
The views and opinions expressed here do not reflect that of CryptoGlobe.com and do not constitute financial advice. Always do your own research.


