
 Ethereum Chart By Trading View
ETHUSD Medium-term Trend: Ranging
- Resistance Levels: $230, $240, $250
- Support Levels: $70, $60, $50
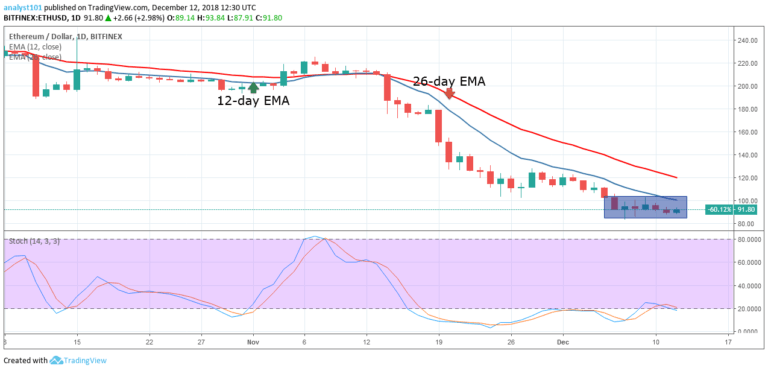
The ETHUSD pair is in a sideways trend. On December 6, the ETH price fell to the low of $91.97 and continued to trade in a range bound movement. This range-bound movement can only be terminated by a price breakout. The crypto’s price as shown by the rectangular block is in the bearish trend zone.
This implies that since the ETH price is below the 12-day EMA and the 26-day EMA, there is the likelihood that the price of Ethereum will fall. However, if the price action continues to show small body candlesticks like the Doji and the spinning tops, the price of Ethereum will continue its range bound movement.
ETHUSD Short-term Trend: Ranging
 Ethereum Chart By Trading View
On the short-term trend, the price of Ethereum was in a sideways trend. The ETH price is in the bearish trend zone as the crypto’s price is at the lower level of price range. On December 6, the crypto’s price was ranging above the $91 price level, but the bears broke the support level as the price fell to the low of $88.
Today, the bulls have recovered as the price is testing the 26-day EMA. Meanwhile, the Stochastic is in the range above 20% range which indicates that the crypto has a bullish momentum and a buy signal.
The views and opinions expressed here do not reflect that of CryptoGlobe.com and do not constitute financial advice. Always do your own research.


