
 Ethereum Chart By Trading View
ETHUSD Medium-term Trend: Bearish
- Resistance Levels: $230, $240, $250
- Support Levels: $80, $70, $60
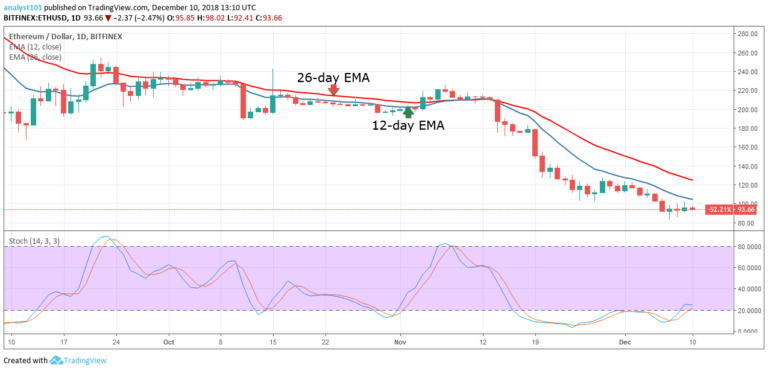
Last week the price of Ethereum was in a bearish trend. The bulls reached the high of $123 while in a bullish movement. On December 2, the bulls were resisted at the $120 price level and the crypto fell to the low of $91.27. Today, the crypto’s price is fluctuating above the $91 price level. As the price ranges a price breakout is imminent. If the bulls take price upward, they will face selling at the $100 price level.
On the other hand, if the bears break the range bound movement, the crypto’s price will find support at the $84 price level. Meanwhile, the price of Ethereum is below the 12-day EMA and the 26-day EMA indicating that the price is in the bearish trend zone. The Stochastic indicator is in the range above 20% which indicates a bullish momentum and a buy signal.
ETHUSD Short-term Trend: Bearish
 Ethereum Chart By Trading View
On the short-term trend, the price of Ethereum was in a sideways trend. On December 7, the crypto’s price fell to the low of $83. Later, the crypto’s price was fluctuating below and above the 12-day EMA and the 26-day EMA. Today, the price is below the 12-day EMA and the 26-day EMA indicating that the price is likely to fall.
The Relative Strength index period 14 is level 44 which indicates that the price is in the sideways trend zone.
The views and opinions expressed here do not reflect that of CryptoGlobe.com and do not constitute financial advice. Always do your own research.


