
ETHUSD Long-term Trend – Bullish
- Distribution territories: $160, $180, $200
- Accumulation territories: $60, $40, $20
Ethereum has been seeing its price rise against the US dollar this week. The cryptocurrency started pushing northward against the 14-day SMA on December 17.

Recently, the cryptocurrency was locked in ranging movements between the $100 and $80 marks. Most of its movements were trending southward under the 14-day SMA’s sell signal, but on December 17 a short spike saw it push north towards the $120 territory. The 14-day SMA is now bending northward, while being below the 50-day SMA.
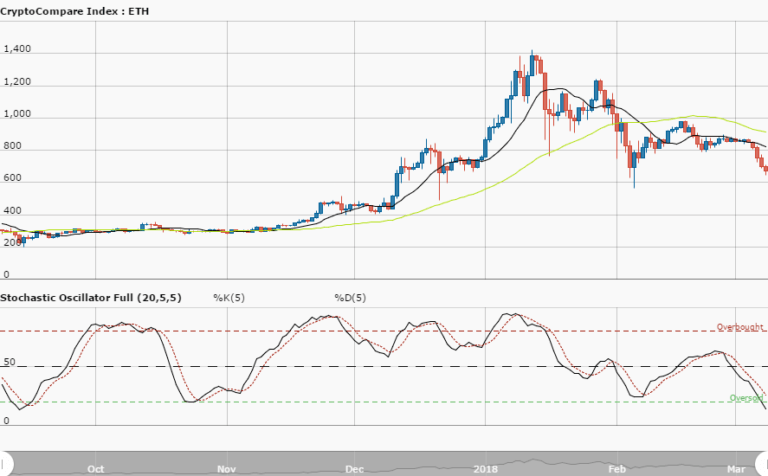
The Stochastic Oscillators have closed at around range 75. The bulls are still expected to continue building their position around the $120 and $80 territories in order to have a strong support for further upward movements. In the event of a sudden breakout of the 50-day SMA’s trend line, there could be a move towards the $180 and $140 marks, but that could allow the bears to retake control for a while.
The views and opinions expressed here do not reflect that of CryptoGlobe.com and do not constitute financial advice. Always do your own research.


