

ADAUSD Medium-term Trend: Bullish
- Resistance levels: $0.080, $0.090, $0.100
- Support levels: $0.030, $0.020, $0.010
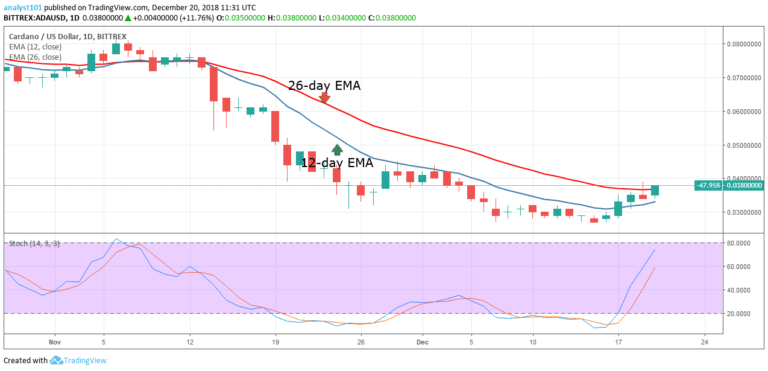
The price of Cardano is now in a bullish trend; as the crypto’s price broke the 12-day EMA and the 26-day EMA. Yesterday, December 19, the price of Cardano made a pullback after it was resisted at the $0.035 price level. The crypto’s price is expected at the $0.045 price level but it may face resistance at the $0.040 and $0.044 price levels.
If the price fails to break the resistance level at $0.040, the crypto will find support at the $0.030 price level. However, if the bears break the $0.030 price level, the crypto will resume its downtrend. The Stochastic indicator is out of the oversold region and it is approaching the range above 40%. This indicates that the price of Cardano has a bullish momentum and a buy signal.
ADAUSD Short-term Trend: Bullish

On the 4-hour chart, the crypto’s price is in a bullish trend. The price of Cardano has recovered from its previous low of $0.036 to the high of $0.038. The crypto’s price is above the 12-day EMA and the 26-day EMA which indicates that the price is likely to rise. The Relative Strength Index period 14 is level 64 which indicates that the price is in the bullish trend zone.
The views and opinions expressed here do not reflect that of CryptoGlobe.com and do not constitute financial advice. Always do your own research.


