

Bitcoin Medium-term Trend: Ranging
- Resistance levels: $4,400, $5,600, $6,000
- Support levels: $3,600, $3,400, $3,200
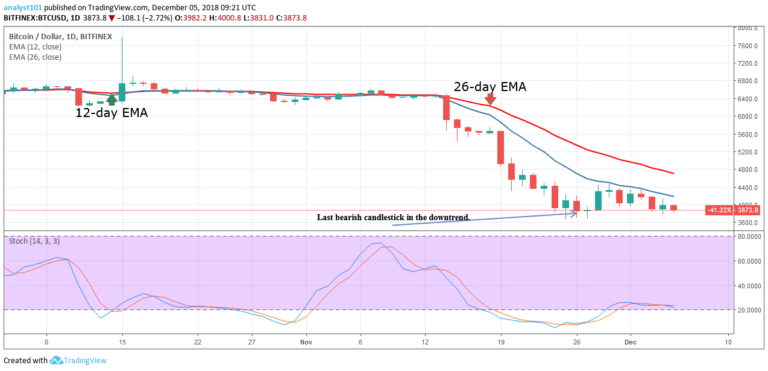
The BTCUSD pair is now in a sideways trend after the bearish candlestick of November 26. The crypto’s price fell the low of $3,864.10 and it commenced a range bound movement. The crypto’s price had been fluctuating around the $3,800 price level since November 26.
On the other hand, if the bulls break the 12-day EMA, the 26-day EMA and remain above it, the cryptocurrency will resume its uptrend.
BTCUSD Short-term Trend: Ranging

On the 4-hour chart, the crypto’s price is in a sideways trend. The price of Bitcoin had been in a sideways trend for some time. On December 3, the bears broke the $4,000 price level but the price was fluctuating between the $3,800 and $3,900 price levels.
From the 4-hour chart, the bulls broke the 12-day EMA but were resisted by the 26-day EMA. Meanwhile, the crypto’ price is below the 12-day EMA and the 26-day EMA indicating that price is likely to fall. The Stochastic indicator is in the range below 40% which indicates that the crypto has a bearish momentum and a sell signal.
The views and opinions expressed here do not reflect that of CryptoGlobe.com and do not constitute financial advice. Always do your own research.


