

BTCUSD Medium-term Trend: Ranging
Resistance levels: $7,000, $7,200, $7,400
Support levels: $4,000, $3,800, $3,600
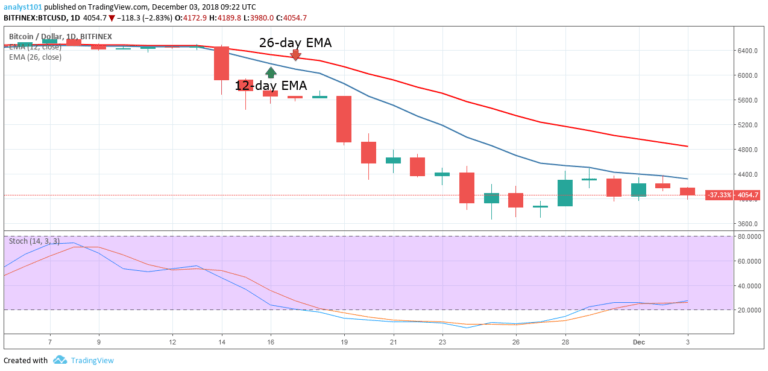
Last week, bitcoin’s price fell to a low of about $3,864 and entered a range bound movement. The cryptocurrency’s price hovered above the $4,000 mark for a while. BTC, on the daily chart, is currently below the 12 and the 26-day EMAs, which indicates the price may fall again. Today, BTC is still holding on to the $4,000 mark.
If the bears manage to break this level, BTC will find support at $3,600 which was one of its previous lows. On the other hand, if $4,000 holds the crypto will continue ranging above it. The Stochastic is currently above the 20% range, meaning BTC has a potential to move up and a buy signal.
BTCUSD Short-term Trend: Bearish

On the 4-hour chart, the crypto’s price is in a bearish trend. Today, the 12-day EMA and the 26-day EMA have resisted the crypto’s price and the digital currency is, as such, on a downward trend. The digital currency is likely going to fall. In addition, the Stochastic is above 20%, showing bearish momentum.
The views and opinions expressed here do not reflect that of CryptoGlobe.com and do not constitute financial advice. Always do your own research.


