

BTCUSD Medium-term Trend: Bearish
- Resistance levels: $7,000, $7,200, $7,400
- Support levels: $3,500, $3,300, $3,100
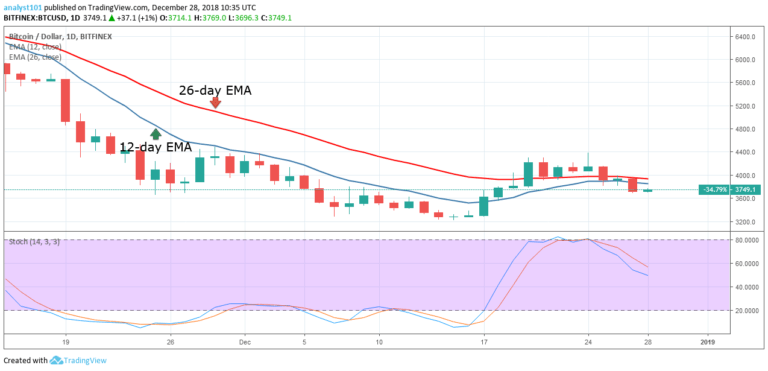
The BTCUSD pair was in a bearish trend as price broke the 12-day EMA and the 26-day EMA to the downside. The crypto’s price fell to the low of $3,730.40 and it is trading below the EMAs which is the bearish trend zone. The price of Bitcoin is now ranging above the $3,700 price level.
However, if the bears break below the $3,700 price level, the crypto will find support at the $3,400 and $3,200 price levels. Meanwhile, the Stochastic indicator is out from the overbought region but below the 60% range. This indicates that the price of Bitcoin is in a bearish momentum and a sell signal.
BTCUSD Short-term Trend: Bearish

On the 4-hour chart, the crypto’s price is in a bearish trend. On December 27, the BTC price fell to the low of $3,730.40 and commenced a range bound movement above that price level. In this time frame, the stochastic indicator is in the oversold region but below the 20 % range. In this case, Bitcoin is in a strong bearish momentum and a sell signal.
Also, the crypto’s price is below the 12-day EMA and the 26-day EMA which indicates that the price is likely to fall.
The views and opinions expressed here do not reflect that of CryptoGlobe.com and do not constitute financial advice. Always do your own research.


