BTCUSD Medium-term Trend: Bullish
- Resistance levels: $7,000, $7,200, $7,400
- Support levels: $3,700, $3,500, $3,300
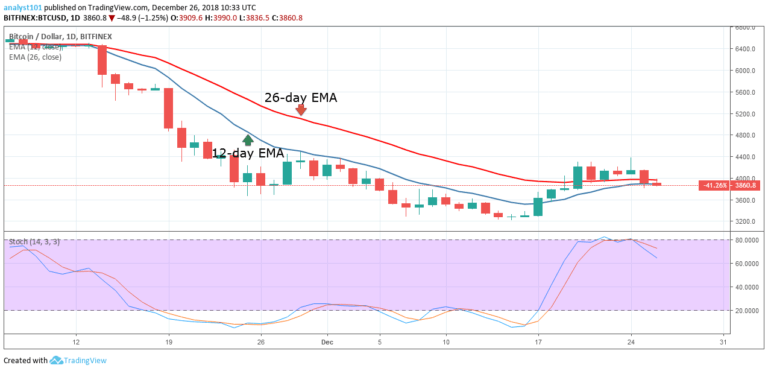
Yesterday, Bitcoin’s price was moving up but saw resistance at the $4,200 mark. The cryptocurrency’s price then dropped managed to break through the 12-day and the 26-day EMA, which indicates its price is likely dropping further. It’s currently approaching the $3,800 level.
If the bears break this support, it’ll keep on falling to lows at the $3,500 – $3,600 level. If the bulls managed to go over the EMAs once again and remain above them, BTC’s price will see further upward movement. The Stochastic indicator is in the range below 80 which is a sell signal.
.BTCUSD Short-term Trend: Bearish
 Bitcoin Chart by Trading View
On the 4-hour chart, the crypto’s price is in a bearish trend. On December 25, BTC to a low of $3,850.50 and entered a range bound movement. Today, the price reached the 12-day EMA and was resisted. Meanwhile, the Stochastic indicator is in the oversold region below 20 which is a sell signal.
The views and opinions expressed here do not reflect that of CryptoGlobe.com and do not constitute financial advice. Always do your own research.


