

BTCUSD Medium-term Trend: Bullish
- Resistance levels: $7,000, $7,200, $7,400
- Support levels: $3,900, $3,700, $3,500
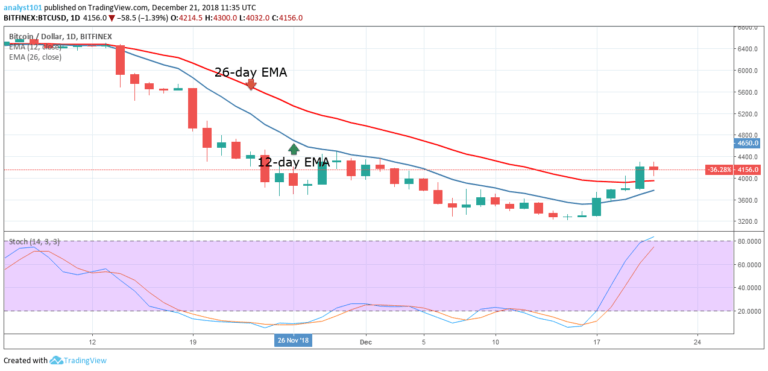
On December 20, the BTCUSD pair was in a bullish trend as price broke the $4,000 price level. Yesterday, the BTC price reached the high of $4,299 but the following day the crypto was resisted. The price of Bitcoin faced resistance at the $4,200 price level as it could not reach the high of $4,500 price level. Today, the crypto’s price is ranging at the $4,000 price level and is in a bearish trend.
However, if the bulls sustain the price above $4,000 and overcome the initial resistance, the crypto will reach the highs of $4,500 and $5,000. On the downside, if the bears break the $4,000 price, the 12-day EMA and the 26-day EMA, then the crypto will resume its downward trend.
Meanwhile, the crypto’s price is above the 12-day EMA and the 26-day EMA indicating that the price is in the bullish trend zone. The Stochastic is approaching the range below 80% indicating that Bitcoin is in a bullish momentum and a buy signal.
BTCUSD Short-term Trend: Bullish

On the 4-hour chart, the crypto’s price is in a bullish trend. Presently, the price of Bitcoin is retracing. A trend line is drawn to know if the retracement will lead to the reversal of the trend. A bullish trend is ongoing if price makes a series of higher highs and higher lows on the trend line.
A Bullish trend is said to be terminated if price breaks the trend line and the following candlestick closed on the opposite of it. Today, the bullish trend is ongoing as at the time of writing.
The views and opinions expressed here do not reflect that of CryptoGlobe.com and do not constitute financial advice. Always do your own research.


