

BTCUSD Medium-term Trend: Bearish
- Resistance levels: $7,000, $7,200, $7,400
- Support levels: $3,400, $3,100, $2,900
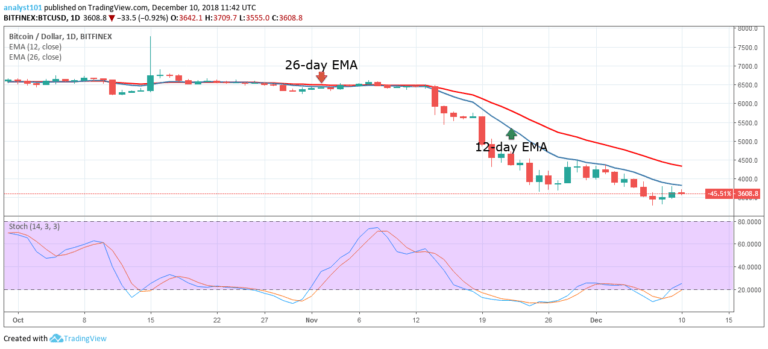
Last week the BTCUSD pair was in a bearish trend. The crypto’s price fell from the $4,000 price level to the low of $3,277.69 but Bitcoin recovered to the high of $3,642.30. Meanwhile, the crypto’s price is below the 12-day EMA and the 26-day EMA which indicates that the price is within the bearish trend zone. However, if the bulls break the $3,600 price level, the price of Bitcoin will resume its uptrend.
On the other hand, if the bears break the $3,400 price level, the crypto will resume its downtrend. Meanwhile, the Stochastic is above the 20% range but the blue band of the Stochastic is above the red band. This implies that the BTC price has a bullish momentum and a buy signal.
BTCUSD Short-term Trend: Ranging

On the 4-hour chart, the crypto’s price is in a bearish trend. The crypto’s price reached the low of $3,367.30 and commenced a range bound movement. The bulls broke the 12-day EMA and the 26-day EMA but could not sustain their hold above the exponential moving averages. The price is neither below nor above the EMAs indicating a sideways trend.
Meanwhile, the Relative Strength Index period 14 is level 47 which indicates that the price is in the sideways trend zone.
The views and opinions expressed here do not reflect that of CryptoGlobe.com and do not constitute financial advice. Always do your own research.


