
BTCUSD Long-term Trend – Bullish
- Distribution territories: $5,000, $6,000, $7,000
- Accumulation territories: $2,500, $2,000, $1,500
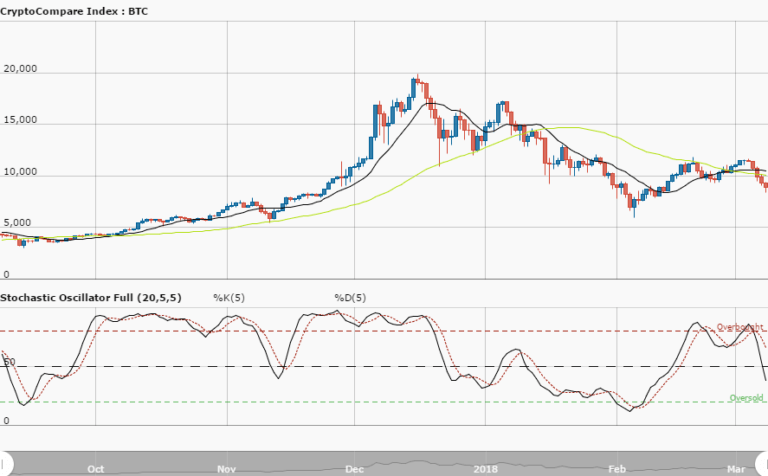
Bitcoin’s price has seen a notable swing upward against the trend line of its 14-day SMA on December 17, after dropping below it on November 14. Currently, the cryptocurrency’s price has been trading around the $4,000 territory, around its 50-day SMA.

Between November 29 and December 6, the cryptocurrency was dropping along its 14-day SMA’s trend line. Its 14-day SMA is below its 50-day SMA. The Stochastic Oscillators are below 80, which means the cryptocurrency may start ranging between the $4,000 and $3,500 marks in the next few trading sessions.
The territory around the $3,200 mark appears to be an important support for BTC and if its broken southwards we would be looking at a worst-case scenario. If it fails, the bears are likely going ot be able to take the cryptocurrency down to the $2,500 mark.
The views and opinions expressed here do not reflect that of CryptoGlobe.com and do not constitute financial advice. Always do your own research.


