

XRPUSD Medium-term Trend: Bullish
Resistance Levels: $0.56, $0.58, $ 0.60
Support Levels: $0.50, $0.48, $0.46
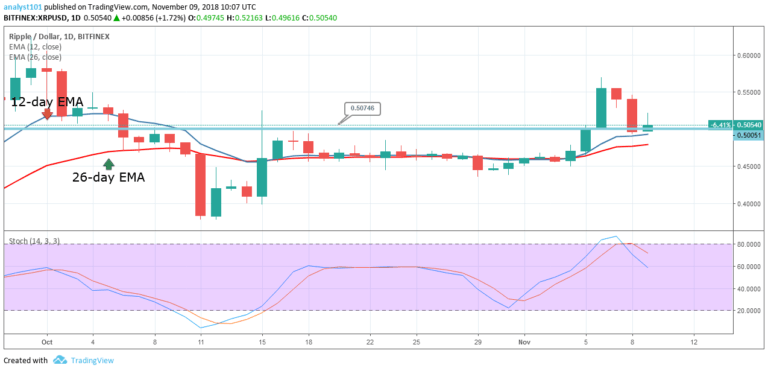
Yesterday, the XRP price was in a bearish trend.The bearish trend was as a result of its inability to break the upper price level of $0.60. However, the bearish trend was terminated at a price of $0.49 and the bulls commenced a bullish movement. The crypto’s price is above the 12-day EMA and the 26-day EMA indicating that price is likely to rise.
If the price rises, the digital currency may face resistance at the price of $0.54. The Stochastic indicator is in the range below 80 which indicates a sell signal and the momentum is increasing on the downside.
XRPUSD Short-term Trend: Ranging

On the short term trend, the XRP price is in a sideways trend. The crypto’s price is fluctuating above the $0.50 price level. The bullish candlestick is being resisted at the 12-day EMA and the price is approaching the $0.50 price level. If the bears break the $0.50 price level, the digital currency will find support at $0.46 price level.
Nevertheless, the Relative Strength Index period 14 is level 48 which indicates that the price is in the sideways trend zone.
The views and opinions expressed here do not reflect that of CryptoGlobe.com and do not constitute financial advice. Always do your own research.


