

XRPUSD Medium-term Trend: Bearish
Resistance Levels: $0.56, $0.58, $ 0.60
Support Levels: $0.50, $0.48, $0.46
Yesterday, the XRP price reached the upper level of price range which is the $0.60 price level. The crypto had been range bound between the levels of $0.50 and $0.60. XRPwas bearish after the crypto’s price was resisted at the price of $0.55. The XRP price fell to the low of $0.51 and commenced a bullish movement. The cryptocurrency is likely to rise because the price is in the bullish trend zone.
Secondly, it is above the $0.50 price level which is a support where the crypto will resume its uptrend. Meanwhile, the Relative Strength Index period 14 is level 60 which indicates that the price is in the bullish trend zone. Meanwhile, the XRP price is above the 12-day EMA and the 26-day EMA indicating that the price is likely to rise. Price is likely to retest the $0.55 price level.
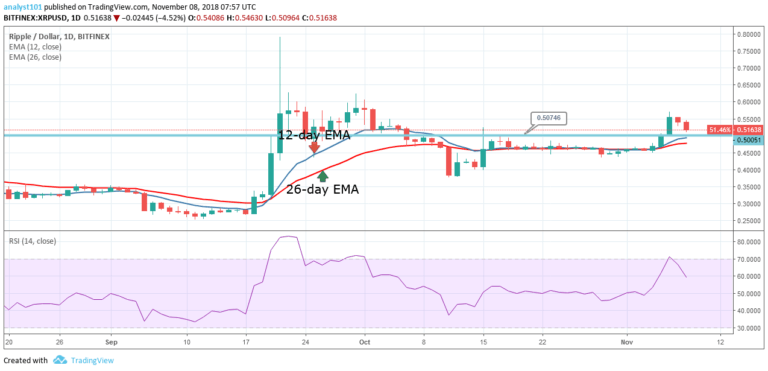
XRPUSD Short-term Trend: Bearish

On the short term trend, the XRP price is in a bearish trend. The crypto’s price broke the 12-day EMA but was resisted by the 26-day EMA in a downward trend. Nevertheless, the Relative Strength Index period 14 is level 53 which indicates that the price is nearing the bullish trend zone.
The views and opinions expressed here do not reflect that of CryptoGlobe.com and do not constitute financial advice. Always do your own research.


