

XRPUSD Medium-term Trend: Bullish
Resistance Levels: $0.56, $0.58, $ 0.60
Support Levels: $0.50, $0.48, $0.46
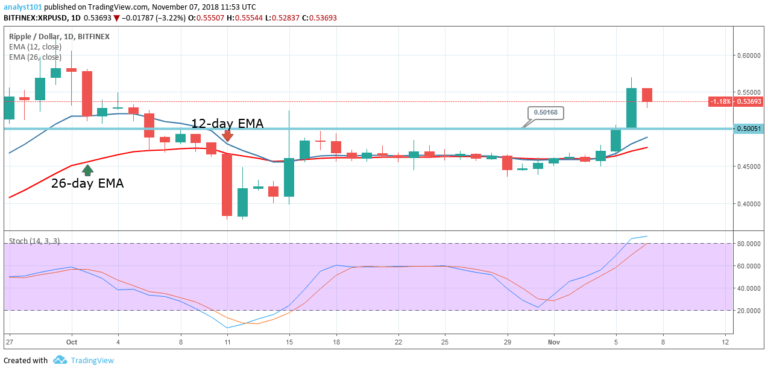
The XRPUSD pair was in a bullish trend yesterday. The crypto’s price reached the high of $57 and was resisted. The $0.60 price level is the upper price level of the previous price range.Therefore, the XRP price may face resistance at the $0.60 price level. The crypto’s price has fallen to the low of $0.53 and it is fluctuating above that level.
Meanwhile, the crypto’s price is above the 12-day EMA and the 26-day EMA indicating that the price is in the bullish trend zone. There a likelihood that the bulls may revisit the $0.60 price level. The Stochastic indicator is approaching the range of 80 indicating a buy signal and a strong momentum.
XRPUSD Short-term Trend: Bullish

On the short term trend, the XRP price is above the exponential moving averages (EMAs) indicating that the price is likely to rise. The Stochastic is below 80, indicating that the bullish trend has been reversed. That is, the blue and red bands of the stochastic are out of the overbought region signaling the reversal. Therefore, traders are to exit their long trades and initiate short trades.
The views and opinions expressed here do not reflect that of CryptoGlobe.com and do not constitute financial advice. Always do your own research.


