

XRPUSD Medium-term Trend: Bullish
Resistance Levels: $0.50, $0.52, $ 0.54
Support Levels: $0.40, $0.38, $0.36
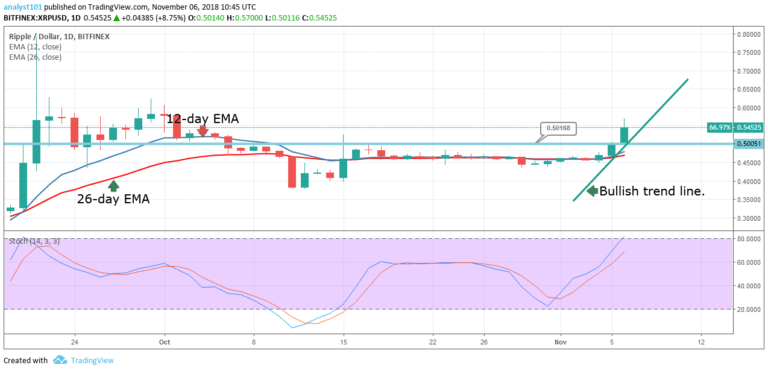
The XRPUSD pair is now in a bullish trend for the third day.The bulls have been able to achieve two things namely coming out of the range bound movement as well as breaking the resistance at $0.47. The price is rallying above the $0.50 price level. A bullish trend line is drawn to determine the duration of the bullish trend. A bullish trend is ongoing as long as the trend line is not broken.
The price is making a series of higher highs and higher lows. If the price breaks the trend line and the following candlestick closes on the opposite of the trend line, the trend is assumed to be terminated. Meanwhile, the crypto’s price is above the 12-day EMA and the 26-day EMA which indicates that the price is in the bullish trend zone.
The price is expected to reach the high of $0.60. On the daily Chart, the Stochastic is in the range of 80, the momentum is strong and the price approaching the overbought area.
XRPUSD Short-term Trend: Bullish

On the short term trend, the XRP price is in a bullish trend. The Stochastic is above 80, the price has reached the overbought area. The momentum is strong and the price is able to close near the top. Also, the bullish trend will continue pushing forward. If the price stays longer at the top then the momentum is said to be high.
The views and opinions expressed here do not reflect that of CryptoGlobe.com and do not constitute financial advice. Always do your own research.


