
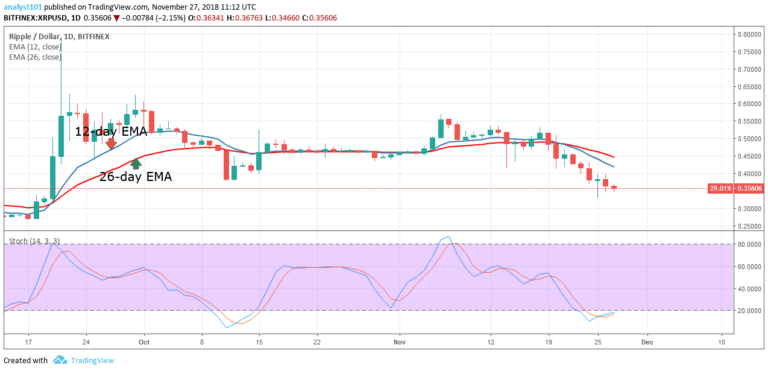

XRPUSD Medium-term Trend: Bearish
Resistance Levels: $0.56, $0.58, $ 0.60
Support Levels: $0.30, $0.28, $0.26
The price of XRP had been bearish in the last ten days. In the last 24 hours, the bearish trend was ongoing. The bottom line is that the crypto’s price is below the 12-day EMA and the 26-day EMA which indicates that the price is likely to fall. The digital currency is approaching a previous price level of $0.34. If the bearish trend continues and the price level is broken then the price will reach a low of $0.24.
On the other hand, if the price holds at the $0.34 price level, the digital currency will reach the highs of $0.43 and $0.45. Meanwhile, the Stochastic is below the range of 20 and the blue and red bands of Stochastic are making a U-turn to be above the range of 20. If the Stochastic comes out of the oversold region and is above the 20 range; it is a buy signal. It also means that the current trend has reversed.
XRPUSD Short-term Trend: Ranging

On the short term trend, the XRP price is in a bearish trend. The digital currency fell to the low of $0.33 and commenced a bullish movement to the 12-day EMA. The 12-day EMA has resisted the bullish candlesticks and the price is ranging. The crypto’s price is below the EMAs which indicates that it is in the bearish trend zone.
The views opinions expressed here do not reflect that of CryptoGlobe.com and do not constitute financial advice. Always do your own research.


