

XRPUSD Medium-term Trend: Bearish
Resistance Levels: $0.56, $0.58, $ 0.60
Support Levels: $0.35, $0.33, $0.31
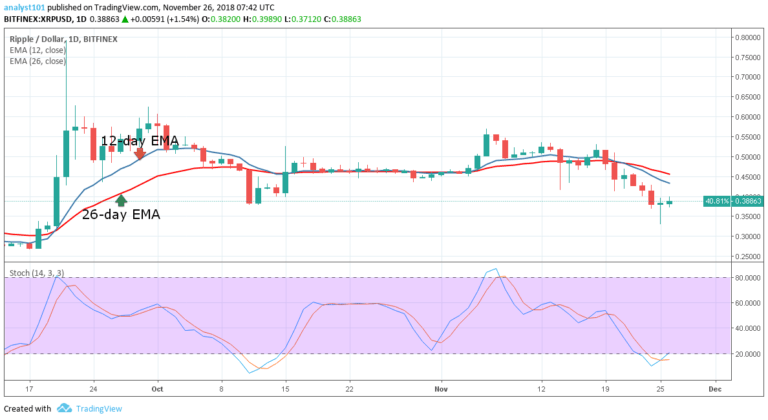
The XRPUSD pair was in a bearish trend last week. The crypto’s price broke the 12-day EMA and the 26-day EMA and it fell in a downward trend. Last week, it was suggested that the bearish trend might result in the digital currency revisiting the previous low of October 11, which was $0.38 price level .On November 24, the crypto fell to the low of $0.38. Today, the XRP price is ranging at that price level.
Meanwhile, the price is still below the 12-day EMA and the 26-day EMA which indicates that the price is in the bearish trend zone.The Stochastic indicator is in the range below 20. However, the blue band is above the red band which is making a U-turn to above the range of 20. If the indicator goes above the range of 20; the current trend is said to be reversed.
XRPUSD Short-term Trend: Ranging

On the short term trend, the XRP price is in a bearish trend. Last week XRP fell to the low of $0.33 and made an immediate bullish movement. The bullish movement broke the 12-day EMA but may face resistance at the 26-day EMA. The Stochastic is indicating a buy signal.
The views opinions expressed here do not reflect that of CryptoGlobe.com and do not constitute financial advice. Always do your own research.


