

XRPUSD Medium-term Trend: Bearish
Resistance Levels: $0.56, $0.58, $ 0.60
Support Levels: $0.40, $0.38, $0.36
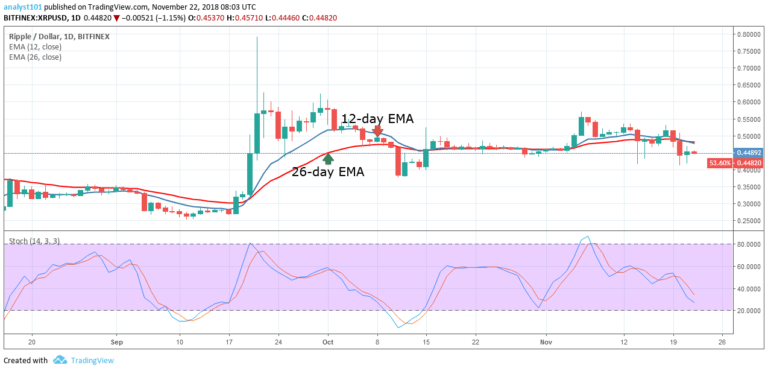
On November 21, the price of XRP was in a sideways trend. On November 20, the crypto’s price was resisted by the 12-day EMA and the 26-day EMA and fell to the low of $0.44. The digital currency is now ranging at the same price level. Today, the crypto’s price is ranging and it is below the exponential moving averages.
When the crypto’s price is below the exponential moving averages, the tendency is to fall. From the price action, if the bears break away from the current price level, the crypto will find support at either $0.43 or $0.40. On the upside, if the price breaks the 12-day EMA and 26-day EMA, the crypto will resume its uptrend. Meanwhile, Stochastic is in the range below 40 which indicates that bears have the upper hand.
XRPUSD Short-term Trend: Ranging

On the short term trend, the XRP price is in a sideways trend. Since November 20, the price fell to the low of $0.44 and commenced a range bound movement. For the past three days, the XRP price has been ranging at the same price level. Meanwhile, the Relative Strength Index period 14 is level 41 which indicates that the price is a sideways trend.
The views opinions expressed here do not reflect that of CryptoGlobe.com and do not constitute financial advice. Always do your own research.


