

XRPUSD Medium-term Trend: Bearish
Resistance Levels: $0.56, $0.58, $ 0.60
Support Levels: $0.40, $0.38, $0.36
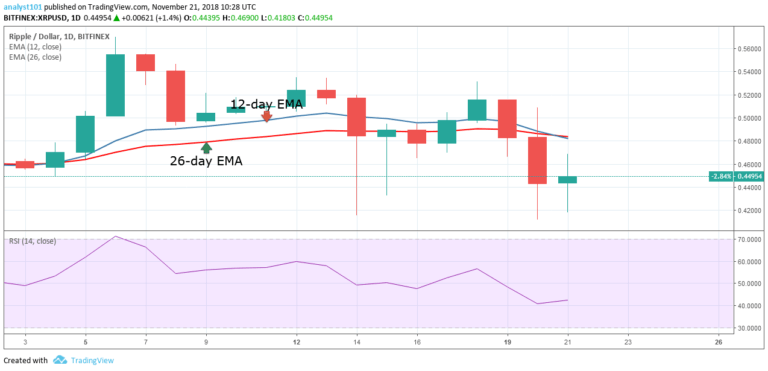
On November 20, the price of XRP was in a bearish trend. It was suggested yesterday that the crypto would fall but would find support at either the $0.44 or $0.45 price levels. The crypto actually fell to the low of $0.44 and commenced a bullish movement. The bulls have to accomplish two things for the XRP price to go up. One is to break the $0.50 price level to the upside.
Secondly, the XRP price should be above the 12-day EMA and the 26-day EMA. If the price reaches these levels, the digital currency will resume its uptrend. However, the XRP price may likely face resistance at the $0.50 price level. Meanwhile, the crypto’s price is below the 12-day EMA and the 26-day EMA indicating that the price is in a bearish trend zone.
Nevertheless, the Relative Strength index period 14 is level 43 which indicates that the price is in the sideways trend zone.
XRPUSD Short-term Trend: Ranging

On the short term trend, the XRP price is in a sideways trend. At the lower time frame, the price action shows high wave candles and spinning tops describing the indecision of the bulls and bears. If the bears take control the market, the crypto will find support at $0.38.
The views opinions expressed here do not reflect that of CryptoGlobe.com and do not constitute financial advice. Always do your own research.


