

XRPUSD Medium-term Trend: Ranging
Resistance Levels: $0.50, $0.52, $ 0.54
Support Levels: $0.40, $0.38, $0.36
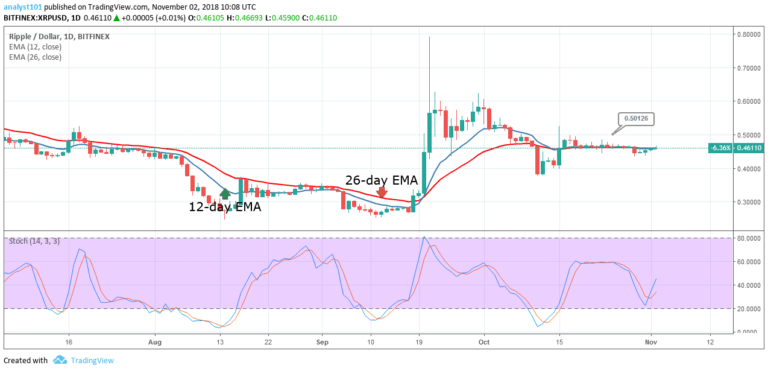
The XRPUSD pair is still trading under a tight range bound movement. On October 29, the XRP price broke out from its range bound movement and fell to the low of $0.44 .It commenced a bullish movement to the previous high. However, the 12-day EMA and the 26-day EMA is now acting as a resistance to the XRP price. The price bars and the exponential moving averages (EMAs) are horizontally flat.
From the indicator, the Stochastic is above 20 which indicates a buy signal.Meanwhile, the crypto’s price is below the 12-day EMA and the 26-day EMA which indicates that the price is in the bearish trend zone
XRPUSD Short-term Trend: Bullish

On the short term trend, the XRP price is in a bullish trend. The crypto’s price will face resistance at the $0.47 price level. From the chart, the stochastic is above 80 which indicates that the momentum is high but appears to be falling. The XRP price is above the 12-day EMA and the 26-day EMA which indicates that the price is in the bullish trend zone.
The views and opinions expressed here do not reflect that of CryptoGlobe.com and do not constitute financial advice. Always do your own research.


