

XRPUSD Medium-term Trend: Bullish
Resistance Levels: $0.56, $0.58, $ 0.60
Support Levels: $0.50, $0.48, $0.46
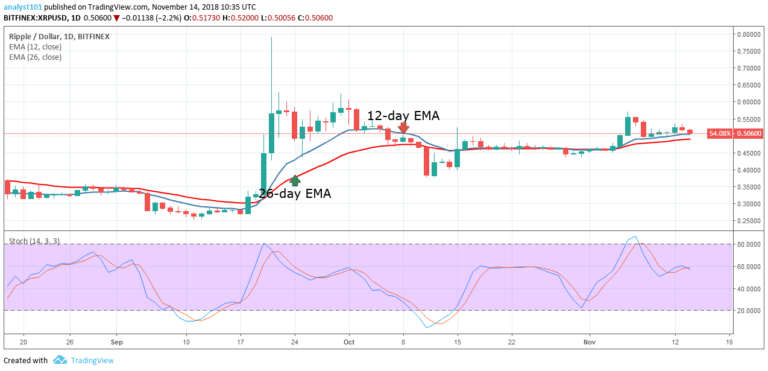
The XRP price is in a bearish trend yesterday. The crypto’s price is above the 12-day EMA and the 26-day EMA indicating that the price is in the bullish trend zone.The 12-day EMA acted as a support for the crypto’s price. The small body’s candlestick like the Doji and the Spinning tops indicated the indecision of buyers and sellers at the $0.51 price level.
The momentum of price is falling on the downside as the Stochastic is in the range below 60. If the price breaks the $0.50 on the downside, the crypto’s price will find support at $0.46. But if it does rise the price will find the previous highs of $0.55 and $0.60.
XRPUSD Short-term Trend: Bearish

On the short term trend, the XRP price is in a bearish trend. The crypto’s price has broken and it is below the 12-day EMA and the 26-day EMA indicating that the price is in the bearish trend zone. The momentum of price is falling on the downside as the Stochastic is in the range below 40. If the downward trend continued the support levels would be breached.
The views opinions expressed here do not reflect that of CryptoGlobe.com and do not constitute financial advice. Always do your own research.


