

XRPUSD Medium-term Trend: Bullish
Resistance Levels: $0.56, $0.58, $ 0.60
Support Levels: $0.50, $0.48, $0.46
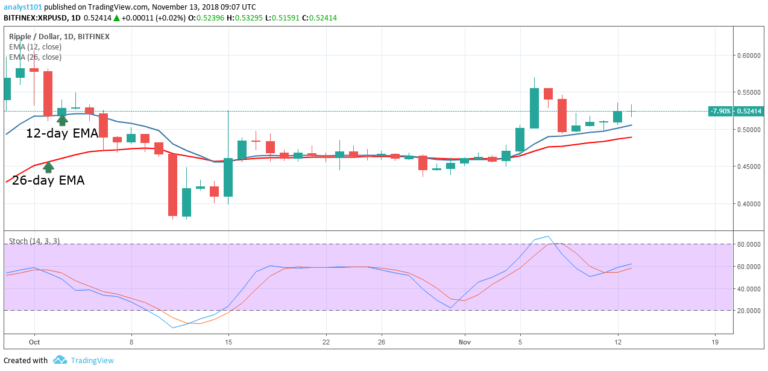
The XRPUSD pair was in a bullish trend for the fifth day. On November 6, the bulls reached the high of $0.57 but fell to the low of $0.49. The 12-day EMA acted as a resistance to the last bearish candlestick and acted as a support to the bullish candlesticks. On November 11, the $0.50 price level was broken and the price is approaching the $0.52 price level.
Nevertheless, as the bulls are pushing price upside, they have two hurdles to jump over. If the crypto’s price breaks the $0.55 price level, price will rally above the $0.60 price level. If the bulls sustain their hold above the $0.60 price level then the bulls will push the price to the high of $0.70. Traders should initiate long trades in anticipation of a bullish trend.
The stochastic is in the range of 60 which indicates a buy signal momentum of price is increasing on the upside.
XRPUSD Short-term Trend: Ranging

On the short term trend, the XRP price is in a sideways trend. The crypto’s price is ranging above the $0.52 price level. The crypto’s price will encounter another price breakout if it ranges. If the crypto’s price breaks below the exponential moving averages, the crypto may find support at $0.46. In the same vein, the Relative Strength Index period 14 is level 60 which indicates price is in the bullish trend zone.
The views opinions expressed here do not reflect that of CryptoGlobe.com and do not constitute financial advice. Always do your own research.


