

XRPUSD Medium-term Trend: Ranging
Resistance Levels: $0.50, $0.52, $ 0.54
Support Levels: $0.40, $0.38, $0.36
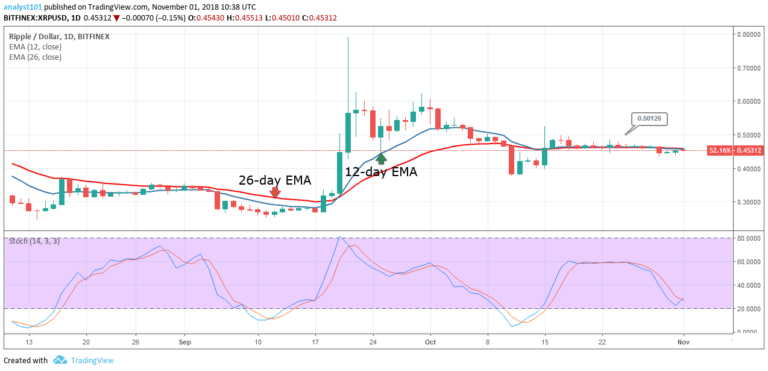
The XRPUSD pair had been on a sideways trend.The price bars, the 12-day EMA and the 26-day EMA are horizontally flat indicating that the crypto is in a sideways trend. On October 30, the crypto’s price made a bullish movement to a high of $0.45. Nevertheless, the XRP price is still ranging above the $0.44 price level which will result in another price breakout.
From the chart, the stochastic indicator is above 20. Some days ago, the stochastic was below 20 indicated that the crypto was in a strong movement to the downside. Today, the stochastic is above 20 indicating a buy signal. Traders can initiate long trades at the current market price. Then a stop loss order below the $0.44 price level.
XRPUSD Short-term Trend: Ranging

On the short term trend, the XRP price is in a sideways trend. The crypto’s price is in a sideways trend on both the medium and short term. There is the tendency that there will be price breakout . The crypto’s price bars are below the 12-day EMA and 26-day EMA which indicates that the price is in the bearish trend zone. Meanwhile, the Relative Strength Index period 14 is level 50 which indicates that the price of crypto is in a sideways trend zone.
The views and opinions expressed here do not reflect that of CryptoGlobe.com and do not constitute financial advice. Always do your own research.


