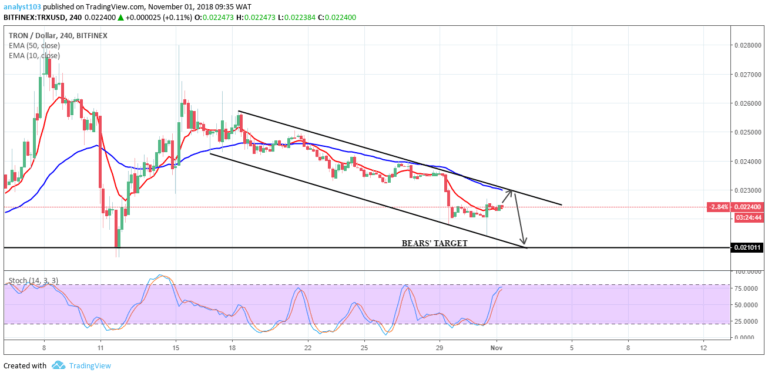
 Tron Chart by TradingView
TRX/USD Medium-term Trend: Ranging
Supply zones: $0.02500, $0.02600, $0.02700
Demand zones$0.01000, $0.00900, $0.00800
TRX is in a range-bound market in its medium-term outlook. The bulls increasing efforts for a strong comeback at $0.01110 in the demand had a brief success as the price was pushed up to $0.01323 in the supply area on 26th November. The bears later returned at the formation of the doji and dropped the price down to $0.01137 in the demand area before losing momentum.
The bulls returned was signalled by the bullish inverted hammer at $0.01158 and full confirmation to the bears’ takeover occurred with the 4-hour bullish opening candle at $0.01206 that broke the 10-EMA as TRXUSD rose to $0.01295 in the supply area within the range.
TRXUSD is in consolidation and trading between $0.1400 in the upper supply area and at $0.1150 in the lower demand area of the range. Traders should wait for a breakout at the upper supply area or breakdown at the lower demand area before a position is taken.
TRX/USD Short-term Trend: Bearish
 Tron Chart by TradingView
The cryptocurrency is in bearish trend in its short-term outlook. The long-tailed candle at $0.01167 suggests trend reversal and possibly the bulls return. TRXUSD was up at $0.01223 in the supply area. $0.01298 in the supply area was retested earlier this morning as the bulls increased their momentum.
The double top formed after the price retested the supply area. The bears returned coupled with two inverted dojis – a strong confirmation to bears’ pressure in the short-term.
The stochastic oscillator is in the overbought region at 82% and its signal points down which suggests downward momentum in price as the bears’ pressure becomes stronger.
The views and opinions expressed here do not reflect that of CryptoGlobe.com and do not constitute financial advice. Always do your own research.


