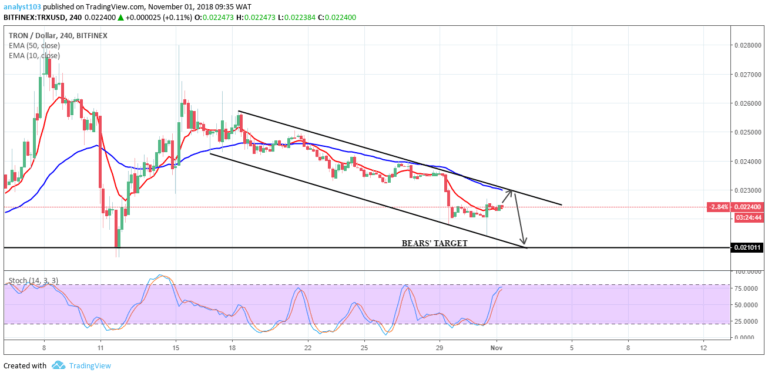
TRX/USD Medium-term Trend: Bearish
Supply zones: $0.02800, $0.02900, $0.03000
Demand zones: $0.01700, $0.01600, $0.01500
TRX continues in a bearish trend in its medium-term outlook. The strong bearish pressure continues to attain new lower lows each day. $0.02251 and $0.02225 at the demand area were the lows on 12th and 13th November respectively. The bearish momentum was sustained at today’s opening with a break at the 78.6 fib level and TRXUSD went down to $0.02200 in the demand area.
The journey to a 100% retracement may have started with the break at the 78.6 fib level but a minor pullback should be expected possibly to the 10-EMA that has been acting as a strong resistance against upward price movement, before bears journey towards the target at $0.021400 in the demand area.
TRX/USD Short-term Trend: Bearish
The cryptocurrency continues in a bearish trend in its short-term outlook. A downward channel best describes the pattern that TRXUSD is in in the short-term. After touching the upper line of the channel twice yesterday at $0.02279 and $0.02276 the bears returned with a stronger pressure that dropped TRXUSD to $0.02241 in the demand area as the session ended yesterday.
With a bearish pinbar formed by the 1-hour opening candle at $0.02227 the bears further pushed the price down to the lower line of the channel at $0.02200 earlier today.
The bulls are currently pushing the cryptocurrency back up to the upper line as confirmed by the stochastic at 26% and its signal point up before a possible bounce and drop in the price in the short-term.
The views and opinions expressed here do not reflect that of CryptoGlobe.com and do not constitute financial advice. Always do your own research.


