

XMRUSD Medium-term Trend: Bearish
Resistance levels: $120, $130, $140
Support levels: $100, $90, $80
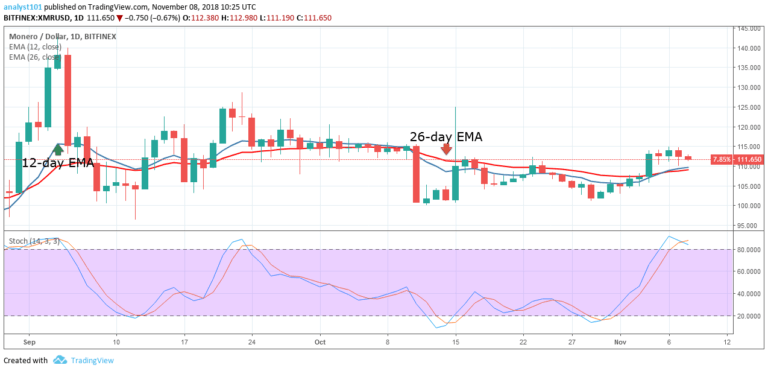
The price of Monero was in a sideways trend yesterday. On October 30, the crypto was in a bullish trend where it reached the high of $113.91. On October 5, the crypto was resisted at the price of $114. The digital currency was on a range bound movement when the price fell to the low of $111.54. Meanwhile, the XMR price is above the 12-day EMA and the 26-day EMA indicating that the price is likely to rise.
However, if the crypto’s price falls to the low of $110 and it holds, traders should initiate long trades in anticipation of a bullish trend. The Stochastic indicator is said to be above 80 which indicates that the price is in the overbought area and the momentum is strong . Also, that the price is able to close on top. The blue and red bands of the Stochastic are approaching the range below 80. If it does the Stochastic will be indicating a sell signal.
XMRUSD Short-term Trend: Ranging

On the 4-hour chart, the XMR price is in a range bound movement. The crypto’s price is neither above nor below the 12 -day EMA and the 26-day EMA indicating a sideways trend. The Relative Strength Index period 14 is level 52 which indicates that the price is in a sideways trend zone.
The views and opinions expressed here do not reflect that of CryptoGlobe.com and do not constitute financial advice. Always do your own research.


