

XMRUSD Medium-term Trend: Bearish
Supply zones: $120, $130, $140
Demand zones: $ 60, $50, $40
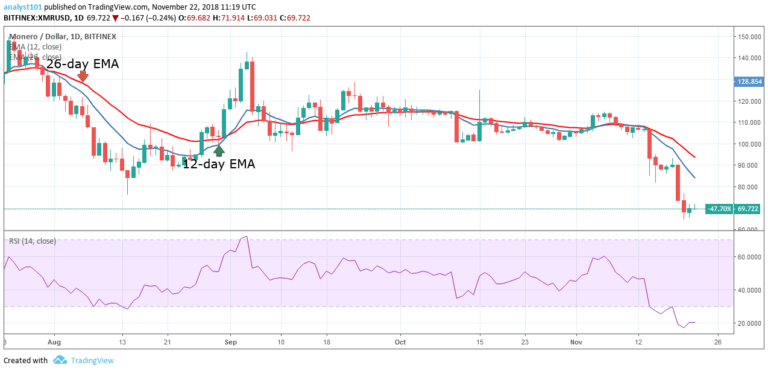
On November 21, the XMRUSD pair was in a bullish trend. The digital currency made a bullish movement after seven days of bearish pressure. The digital currency had been in price fluctuations since the beginning of September. This has been described by the horizontal lines of 12-day EMA and the 26-day EMA which indicates that the price was previously in a range bound movement.
On November 14, the 12-day EMA and the 26-day EMA resisted the price which resulted in the downward fall of the digital currency. The crypto’s price fell to the low of $68.09 and commenced a bullish movement. Meanwhile, the Relative Strength Index period 14 is level 20 which indicates that the price has reached the oversold region of the market suggesting bulls to take control of the market.
Traders are to initiate long trades in anticipation of a bullish trend. Then a stop loss order below the $65 price level. Meanwhile, the price is still below the 12-day EMA and the 26-day EMA indicating that the price is in the bearish trend zone.
XMRUSD Short-term Trend: Ranging

On the short term trend, the price of XMR is in a sideways trend. The crypto’s price fell to the low of $67.50 and commenced a range bound movement. The Stochastic indicator is in the range above 40 which indicates a buy signal and that the bullish momentum is increasing.
The views and opinions expressed here do not reflect that of CryptoGlobe.com and do not constitute financial advice. Always do your own research.


