

XMRUSD Medium-term Trend: Ranging
Supply zones: $120, $130, $140
Demand zones: $ 100, $90, $80
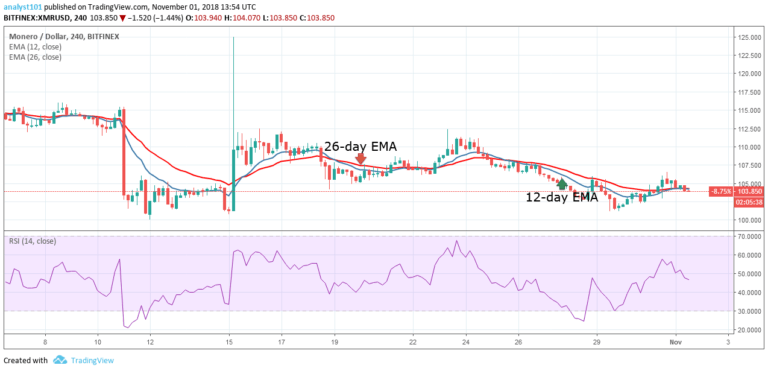
The price of Monero had been in a sideways trend since October 11. On October 11, the crypto’s price fell at the resistance of the 26-day EMA and at the low of $100.91. The crypto commenced its fluctuations above the $100 price level. The price of Monero is in the bearish trend zone as the price is below the 12-day EMA and the 26-day EMA. On the other hand, the Stochastic indicator is above 20.
In the previous days, the Stochastic had fallen below 20 when the cryptocurrency was oversold. That is, the price of Monero was in a strong momentum on the downward side. Today, the price is above 20 which indicates a buy signal. The bearish trend is reversing as the blue band is above the stochastic’s red band. Traders can initiate long trades with a stop loss below the $100 price level.
Meanwhile, the price is below the 12-day EMA and the 26-day EMA which indicates that price is in the bearish trend zone.
XMRUSD Short-term Trend: Ranging

On the short term trend, the price of XMR is in a sideways trend.The crypto’s price bars are above the 12-day EMA and the 26-day EMA which indicates that the price is likely to rise. Meanwhile, the Relative Strength Index period 14 is level 46 which indicates that the price of the crypto is in a sideways trend zone.
The views and opinions expressed here do not reflect that of CryptoGlobe.com and do not constitute financial advice. Always do your own research.


