
XMR/USD Long-term Trend: Bearish
Resistance levels: $120, $130, $140
Support levels: $100, $90, $80
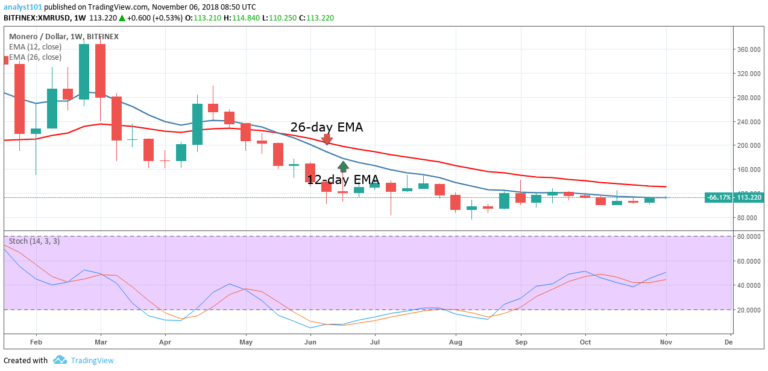
The overall trend for the price of Monero was a bearish trend in the month of October. The crypto had an opening balance of $115.82 but fell to the low of $101.91 on October 29. The price of Monero depreciated by 12% in the month of October 2018. In the first week of November, the XMRUSD pair was in a bullish trend in the lower time frame. In the weekly chart, price of the digital currency is below the 12-day EMA and the 26-day EMA which indicates that price is in the bearish trend zone.

Nevertheless, the Stochastic indicator is above the range of 40. This indicates a buy signal and that the momentum of the crypto’s price is increasing on the upside.The crypto’s price is likely to face resistance at the $115 price level. However, If the bulls overcome the $115 price level, the crypto will reach the high of $140.
The views and opinions expressed here do not reflect that of CryptoGlobe.com and do not constitute financial advice. Always do your own research.


