
XMR/USD Long-term Trend: Bearish
Resistance levels: $110, $115, $120
Support levels: $45, $40, $35
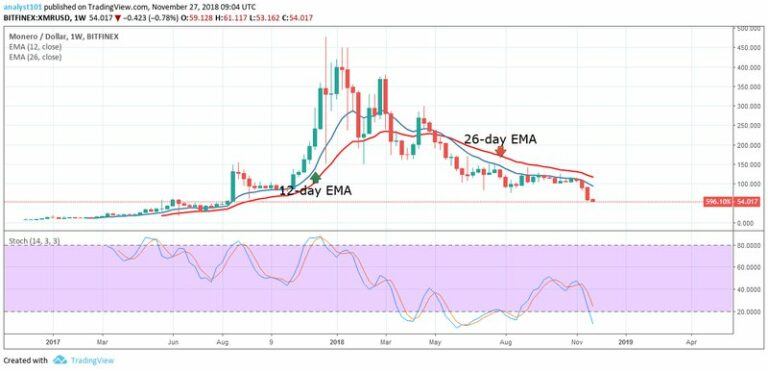
The price of Monero had been bearish in the month of November 2018. On November 1, the digital currency had an opening balance of $105.36. On November 4, the XMR price was in a bullish trend where it reached the high of $113 but the crypto’s price was resisted and fell below the 12-day EMA and the 26-day EMA. On November 14, the crypto’s price was resisted by the EMAs and price fell in a downward trend. On November 19, the digital currency was in the bearish trend zone and continued its downward fall.

The downward trend has continued as at the time of writing. Meanwhile, the crypto’s price is below the 12-day EMA and the 26-day EMA indicating that price is in the bearish trend zone. The Stochastic is below the range of 20 which implies that the bearish momentum is strong. The bearish pressure is ongoing and the price is likely to reach the low of $50 price level. The crypto is trading at $53.95 as at the time of writing.
The views and opinions expressed here do not reflect that of CryptoGlobe.com and do not constitute financial advice. Always do your own research.


