
 Litecoin Chart by Trading View
LTCUSD Medium-term Trend: Bullish
Resistance Levels: $65, $67, $69
Support Levels: $50, $48, $46
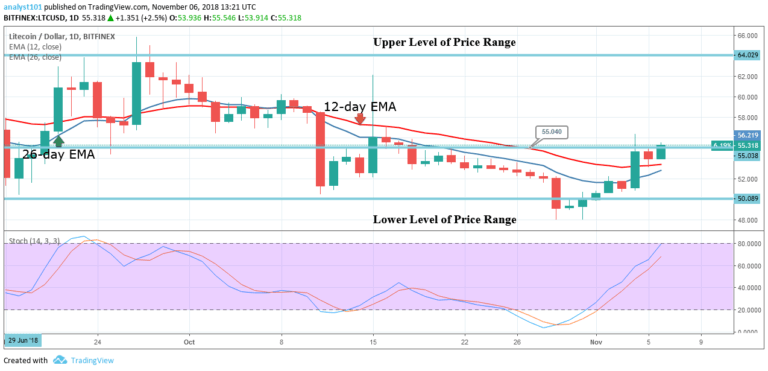
Yesterday, the price of Litecoin was in a bearish trend. On November 4, the bulls reached the high of $56.36 and were resisted. The cryptocurrency faced resistance at the price of $55. If the bulls clear the resistance at $55, the price of Litecoin will reach the upper level of price range. LTC is presently range bound between the levels of $50 and $65.
Meanwhile, crypto’s price is above the 12-day EMA and the 26-day EMA which indicates that the price is in the bullish trend zone. The Stochastic is in range of 60 and approaching 80. It indicates a buy signal and the momentum of price is increasing on the upside.
LTCUSD Short-term Trend: Bullish
 Litecoin Chart by Trading View
On the short term trend, the price of Litecoin is in a bullish trend. On November 5, a bearish candlestick was resisted at the price of $55.11 and it fell to a range bound movement. The $55 price level is likely to be broken. The Relative Strength Index period 14 is level 70 which indicates that the price is in the bullish trend zone.
The views and opinions expressed here do not reflect that of CryptoGlobe.com and do not constitute financial advice. Always do your own research.


