
 Litecoin Chart by Trading View
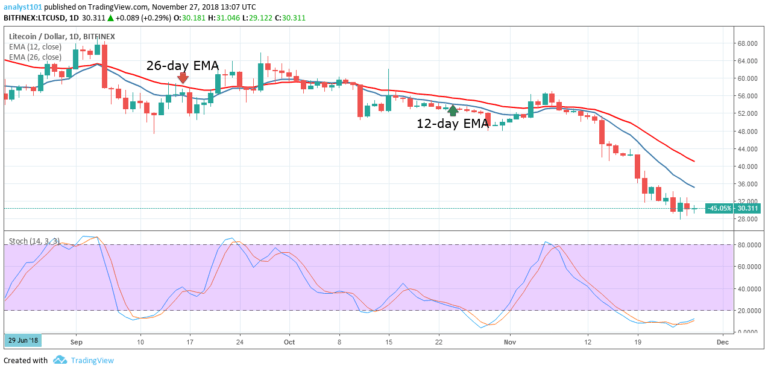
LTCUSD Medium-term Trend: Bearish
Resistance Levels: $65, $70, $75
Support Levels: $25, $20, $15
The price of Litecoin was in a bearish trend yesterday. On November 25, the crypto’s price broke the $30 price level to the low of $28 but pulled back above the support level. The price is fluctuating below and above the support level of $30. As the price is ranging above the $30 price level – it is likely that price will fall in line with the current trend. The crypto’s price will find support at $25 if the bearish trend continued.
Meanwhile the price of Litecoin is below the 12-day EMA and the 26-day EMA which indicates that it is likely to fall. From the Stochastic indicator, the reading is below 20 which indicates that it is in the oversold region of the market. The bearish momentum is said to be strong and the price will remain bearish as long as the stochastic bands are below the 20 range.
LTCUSD Short-term Trend: Ranging
 Litecoin Chart by Trading View
On the short term trend, the price of Litecoin is in a sideways trend. The crypto’s price fell to the low of $28 and it is ranging above it. As the crypto’s price ranges it may face resistance at the 12-day EMA or break the levels and rise.
The views and opinions expressed here do not reflect that of CryptoGlobe.com and do not constitute financial advice. Always do your own research.


