
 Ethereum Chart By Trading View
ETHUSD Medium-term Trend: Bearish
Resistance Levels: $230, $240, $250
Support Levels: $100, $90, $80
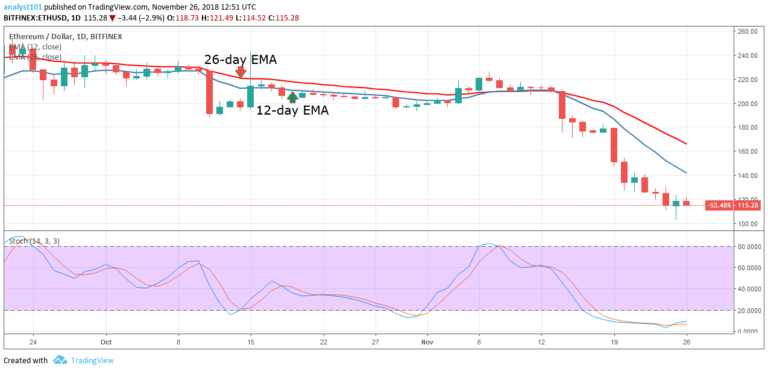
Last week the ETHUSD pair had been in a bearish trend. On November 19, it was trading above the $150 price level but has fallen to the low of $114.80. Today, the digital currency is fluctuating above the November 24 low of $114 price level. From the daily chart, the Stochastic indicator is in the range below 20. This implies that the price of Ethereum is in the oversold region of the market.
The digital currency is likely to reach a low of $100. As long as the Stochastic bands remain in the oversold region, the crypto will continue its downward trend. Meanwhile, the crypto’s price is below the 12-day EMA and the 26-day EMA which indicates that the price is likely to fall.
ETHUSD Short-term Trend: Bearish
 Ethereum Chart By Trading View
On the short-term trend, the price of Ethereum is in a bearish trend. The price of the digital currency fell to the low of $107.13 and made a bullish movement to the 12-day EMA. The 12-day EMA is resisting the bullish movement. If the crypto falls below the 12-day EMA, the crypto will resume its downward trend.
The views and opinions expressed here do not reflect that of CryptoGlobe.com and do not constitute financial advice. Always do your own research.


