
 Ethereum Chart By Trading View
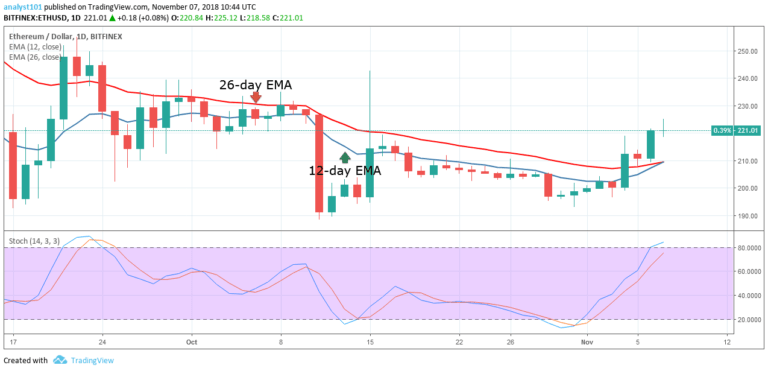
ETHUSD Medium-term Trend: Bullish
Resistance Levels: $220, $230, $240
Support Levels: $210, $200, $190
The ETHUSD pair was in a bullish trend yesterday. On October 29, the crypto’s price commenced its bullish movement to the $200 price level. The $200 price level had been the major support level of Ethereum. A level where there are more buyers than sellers. The price of Ethereum is likely to face resistance at the $220 price level.
If the bulls break the $220 price level, the price will rally at the $240 price level. The stochastic indicator is in the range of 80 which indicates that the buy signal has reached the overbought region. The momentum of the crypto’s price is strong. If the price remains at the overbought region for long, then the momentum is said to be high.
Meanwhile, the price of Ethereum is above the 12-day EMA and the 26-day EMA which indicates that the price is in the bullish trend zone.
ETHUSD Short-term Trend: Bullish
 Ethereum Chart By Trading View
On the short-term trend, the price of Ethereum is in a bullish trend. On the 4-hour chart, the stochastic is coming out of the overbought region and falling below the region of 80. It indicates that the momentum is on a downward side and which will result in a sell signal. From the price action, the higher highs and higher lows have been disrupted. The price is likely to break the trend line and terminate the bullish trend.
The views and opinions expressed here do not reflect that of CryptoGlobe.com and do not constitute financial advice. Always do your own research.


